Immigrants from Nigeria vs Serbian Median Earnings
COMPARE
Immigrants from Nigeria
Serbian
Median Earnings
Median Earnings Comparison
Immigrants from Nigeria
Serbians
$45,030
MEDIAN EARNINGS
12.2/ 100
METRIC RATING
226th/ 347
METRIC RANK
$48,677
MEDIAN EARNINGS
95.9/ 100
METRIC RATING
117th/ 347
METRIC RANK
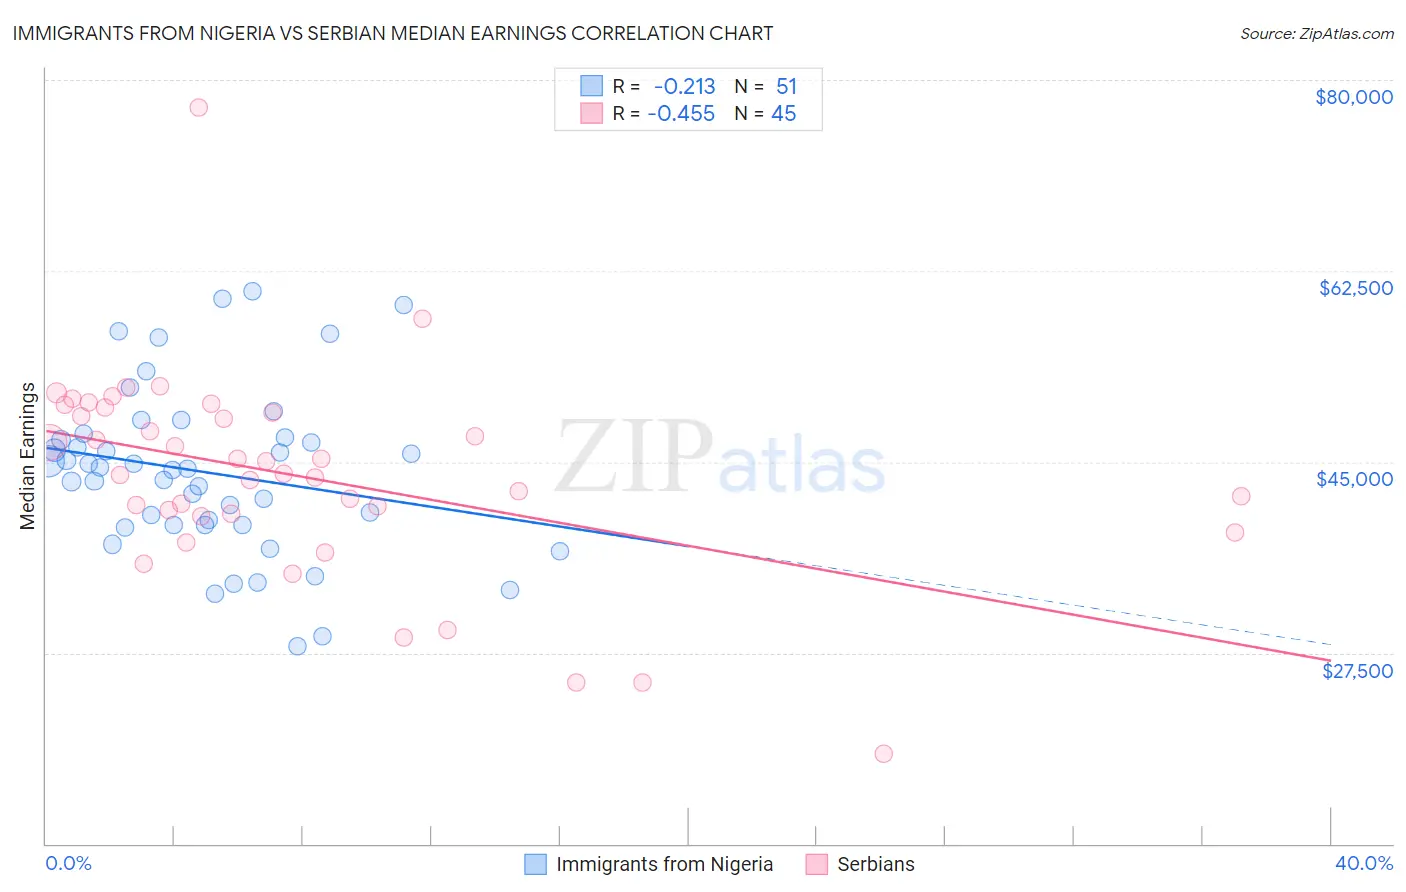
Immigrants from Nigeria vs Serbian Median Earnings Correlation Chart
The statistical analysis conducted on geographies consisting of 283,479,904 people shows a weak negative correlation between the proportion of Immigrants from Nigeria and median earnings in the United States with a correlation coefficient (R) of -0.213 and weighted average of $45,030. Similarly, the statistical analysis conducted on geographies consisting of 267,654,810 people shows a moderate negative correlation between the proportion of Serbians and median earnings in the United States with a correlation coefficient (R) of -0.455 and weighted average of $48,677, a difference of 8.1%.
Median Earnings Correlation Summary
| Measurement | Immigrants from Nigeria | Serbian |
| Minimum | $28,094 | $18,250 |
| Maximum | $60,652 | $77,452 |
| Range | $32,558 | $59,202 |
| Mean | $44,023 | $43,689 |
| Median | $44,326 | $43,879 |
| Interquartile 25% (IQ1) | $39,209 | $40,125 |
| Interquartile 75% (IQ3) | $47,273 | $49,731 |
| Interquartile Range (IQR) | $8,064 | $9,606 |
| Standard Deviation (Sample) | $7,558 | $9,625 |
| Standard Deviation (Population) | $7,484 | $9,517 |
Similar Demographics by Median Earnings
Demographics Similar to Immigrants from Nigeria by Median Earnings
In terms of median earnings, the demographic groups most similar to Immigrants from Nigeria are Native Hawaiian ($45,027, a difference of 0.010%), Immigrants from Iraq ($44,988, a difference of 0.090%), Immigrants from Cambodia ($45,090, a difference of 0.13%), West Indian ($45,132, a difference of 0.23%), and Scotch-Irish ($44,924, a difference of 0.24%).
| Demographics | Rating | Rank | Median Earnings |
| Dutch | 18.4 /100 | #219 | Poor $45,370 |
| Ecuadorians | 15.3 /100 | #220 | Poor $45,214 |
| Immigrants | Guyana | 15.1 /100 | #221 | Poor $45,204 |
| Immigrants | Panama | 15.0 /100 | #222 | Poor $45,198 |
| Whites/Caucasians | 15.0 /100 | #223 | Poor $45,197 |
| West Indians | 13.9 /100 | #224 | Poor $45,132 |
| Immigrants | Cambodia | 13.2 /100 | #225 | Poor $45,090 |
| Immigrants | Nigeria | 12.2 /100 | #226 | Poor $45,030 |
| Native Hawaiians | 12.2 /100 | #227 | Poor $45,027 |
| Immigrants | Iraq | 11.6 /100 | #228 | Poor $44,988 |
| Scotch-Irish | 10.7 /100 | #229 | Poor $44,924 |
| Immigrants | Western Africa | 10.3 /100 | #230 | Poor $44,893 |
| Japanese | 9.5 /100 | #231 | Tragic $44,825 |
| Delaware | 9.0 /100 | #232 | Tragic $44,783 |
| Immigrants | Sudan | 8.8 /100 | #233 | Tragic $44,767 |
Demographics Similar to Serbians by Median Earnings
In terms of median earnings, the demographic groups most similar to Serbians are Immigrants from Jordan ($48,673, a difference of 0.010%), Polish ($48,659, a difference of 0.040%), Korean ($48,727, a difference of 0.10%), Carpatho Rusyn ($48,617, a difference of 0.12%), and Arab ($48,599, a difference of 0.16%).
| Demographics | Rating | Rank | Median Earnings |
| Immigrants | Ethiopia | 97.1 /100 | #110 | Exceptional $48,924 |
| Immigrants | Zimbabwe | 97.0 /100 | #111 | Exceptional $48,913 |
| Northern Europeans | 96.9 /100 | #112 | Exceptional $48,887 |
| Immigrants | Kuwait | 96.8 /100 | #113 | Exceptional $48,861 |
| Moroccans | 96.7 /100 | #114 | Exceptional $48,838 |
| Chinese | 96.7 /100 | #115 | Exceptional $48,836 |
| Koreans | 96.2 /100 | #116 | Exceptional $48,727 |
| Serbians | 95.9 /100 | #117 | Exceptional $48,677 |
| Immigrants | Jordan | 95.9 /100 | #118 | Exceptional $48,673 |
| Poles | 95.8 /100 | #119 | Exceptional $48,659 |
| Carpatho Rusyns | 95.5 /100 | #120 | Exceptional $48,617 |
| Arabs | 95.4 /100 | #121 | Exceptional $48,599 |
| Chileans | 94.8 /100 | #122 | Exceptional $48,504 |
| Immigrants | Syria | 93.9 /100 | #123 | Exceptional $48,375 |
| Brazilians | 93.7 /100 | #124 | Exceptional $48,356 |