Sudanese vs Jamaican Median Earnings
COMPARE
Sudanese
Jamaican
Median Earnings
Median Earnings Comparison
Sudanese
Jamaicans
$44,419
MEDIAN EARNINGS
5.6/ 100
METRIC RATING
238th/ 347
METRIC RANK
$43,343
MEDIAN EARNINGS
1.3/ 100
METRIC RATING
257th/ 347
METRIC RANK
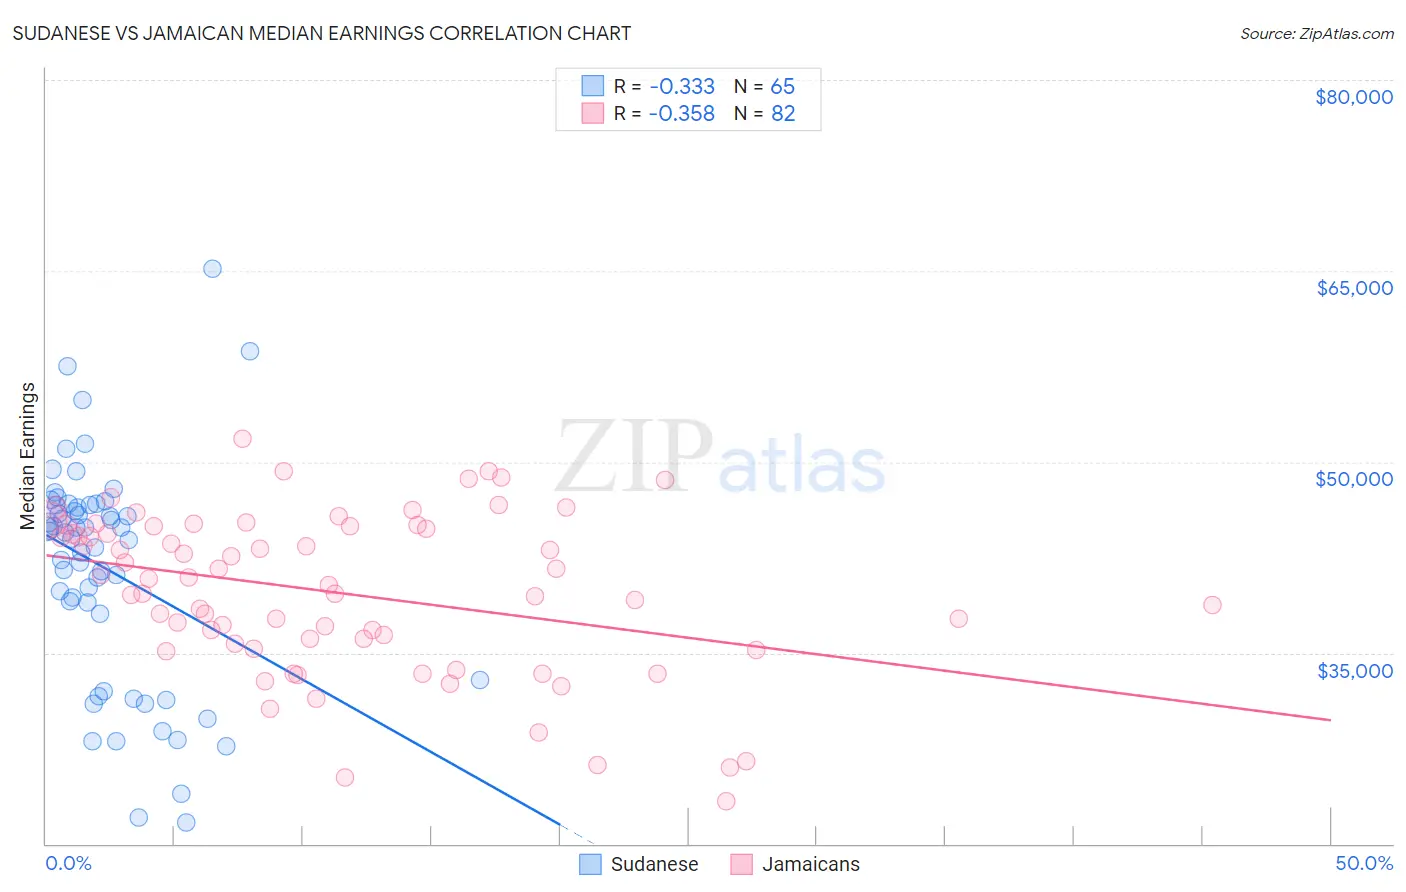
Sudanese vs Jamaican Median Earnings Correlation Chart
The statistical analysis conducted on geographies consisting of 110,129,376 people shows a mild negative correlation between the proportion of Sudanese and median earnings in the United States with a correlation coefficient (R) of -0.333 and weighted average of $44,419. Similarly, the statistical analysis conducted on geographies consisting of 368,067,864 people shows a mild negative correlation between the proportion of Jamaicans and median earnings in the United States with a correlation coefficient (R) of -0.358 and weighted average of $43,343, a difference of 2.5%.
Median Earnings Correlation Summary
| Measurement | Sudanese | Jamaican |
| Minimum | $21,638 | $23,316 |
| Maximum | $65,192 | $51,789 |
| Range | $43,554 | $28,473 |
| Mean | $41,590 | $39,739 |
| Median | $44,417 | $40,605 |
| Interquartile 25% (IQ1) | $35,456 | $35,749 |
| Interquartile 75% (IQ3) | $46,591 | $44,901 |
| Interquartile Range (IQR) | $11,136 | $9,152 |
| Standard Deviation (Sample) | $8,811 | $6,295 |
| Standard Deviation (Population) | $8,743 | $6,257 |
Demographics Similar to Sudanese and Jamaicans by Median Earnings
In terms of median earnings, the demographic groups most similar to Sudanese are Immigrants from Ecuador ($44,462, a difference of 0.10%), Senegalese ($44,373, a difference of 0.10%), Aleut ($44,241, a difference of 0.40%), Samoan ($44,206, a difference of 0.48%), and Immigrants from Venezuela ($44,163, a difference of 0.58%). Similarly, the demographic groups most similar to Jamaicans are Alaskan Athabascan ($43,393, a difference of 0.12%), Immigrants from Middle Africa ($43,416, a difference of 0.17%), Liberian ($43,536, a difference of 0.45%), Somali ($43,567, a difference of 0.52%), and Hawaiian ($43,673, a difference of 0.76%).
| Demographics | Rating | Rank | Median Earnings |
| Immigrants | Ecuador | 5.9 /100 | #237 | Tragic $44,462 |
| Sudanese | 5.6 /100 | #238 | Tragic $44,419 |
| Senegalese | 5.3 /100 | #239 | Tragic $44,373 |
| Aleuts | 4.4 /100 | #240 | Tragic $44,241 |
| Samoans | 4.2 /100 | #241 | Tragic $44,206 |
| Immigrants | Venezuela | 4.0 /100 | #242 | Tragic $44,163 |
| Sub-Saharan Africans | 3.7 /100 | #243 | Tragic $44,118 |
| Immigrants | Nonimmigrants | 3.7 /100 | #244 | Tragic $44,117 |
| Immigrants | Burma/Myanmar | 3.2 /100 | #245 | Tragic $43,998 |
| Immigrants | West Indies | 3.1 /100 | #246 | Tragic $43,989 |
| Immigrants | Cabo Verde | 3.0 /100 | #247 | Tragic $43,963 |
| Nepalese | 2.6 /100 | #248 | Tragic $43,860 |
| Malaysians | 2.6 /100 | #249 | Tragic $43,844 |
| Alaska Natives | 2.3 /100 | #250 | Tragic $43,750 |
| Tsimshian | 2.1 /100 | #251 | Tragic $43,695 |
| Hawaiians | 2.0 /100 | #252 | Tragic $43,673 |
| Somalis | 1.8 /100 | #253 | Tragic $43,567 |
| Liberians | 1.7 /100 | #254 | Tragic $43,536 |
| Immigrants | Middle Africa | 1.4 /100 | #255 | Tragic $43,416 |
| Alaskan Athabascans | 1.4 /100 | #256 | Tragic $43,393 |
| Jamaicans | 1.3 /100 | #257 | Tragic $43,343 |