Immigrants from Zaire vs Jamaican 2nd Grade
COMPARE
Immigrants from Zaire
Jamaican
2nd Grade
2nd Grade Comparison
Immigrants from Zaire
Jamaicans
97.6%
2ND GRADE
4.3/ 100
METRIC RATING
224th/ 347
METRIC RANK
97.5%
2ND GRADE
0.6/ 100
METRIC RATING
256th/ 347
METRIC RANK
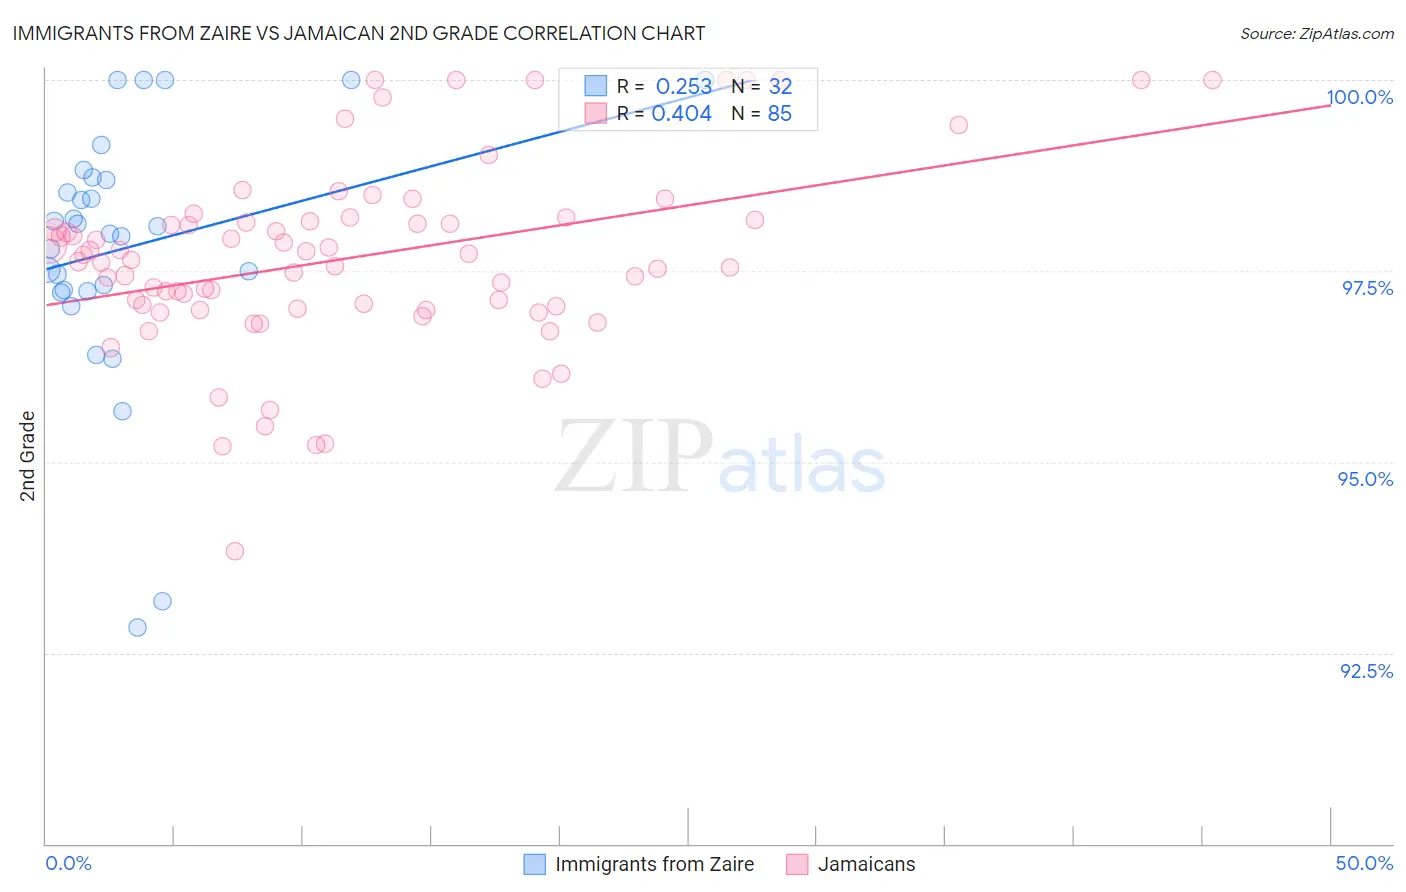
Immigrants from Zaire vs Jamaican 2nd Grade Correlation Chart
The statistical analysis conducted on geographies consisting of 107,255,805 people shows a weak positive correlation between the proportion of Immigrants from Zaire and percentage of population with at least 2nd grade education in the United States with a correlation coefficient (R) of 0.253 and weighted average of 97.6%. Similarly, the statistical analysis conducted on geographies consisting of 368,084,732 people shows a moderate positive correlation between the proportion of Jamaicans and percentage of population with at least 2nd grade education in the United States with a correlation coefficient (R) of 0.404 and weighted average of 97.5%, a difference of 0.16%.
2nd Grade Correlation Summary
| Measurement | Immigrants from Zaire | Jamaican |
| Minimum | 92.8% | 93.8% |
| Maximum | 100.0% | 100.0% |
| Range | 7.2% | 6.2% |
| Mean | 97.8% | 97.7% |
| Median | 98.0% | 97.7% |
| Interquartile 25% (IQ1) | 97.2% | 97.0% |
| Interquartile 75% (IQ3) | 98.7% | 98.2% |
| Interquartile Range (IQR) | 1.5% | 1.1% |
| Standard Deviation (Sample) | 1.7% | 1.2% |
| Standard Deviation (Population) | 1.7% | 1.2% |
Similar Demographics by 2nd Grade
Demographics Similar to Immigrants from Zaire by 2nd Grade
In terms of 2nd grade, the demographic groups most similar to Immigrants from Zaire are Immigrants from Sudan (97.6%, a difference of 0.0%), Sierra Leonean (97.6%, a difference of 0.0%), Tongan (97.6%, a difference of 0.0%), Immigrants from Morocco (97.6%, a difference of 0.010%), and Iraqi (97.6%, a difference of 0.010%).
| Demographics | Rating | Rank | 2nd Grade |
| Uruguayans | 6.2 /100 | #217 | Tragic 97.7% |
| Sudanese | 5.7 /100 | #218 | Tragic 97.7% |
| Immigrants | Panama | 5.1 /100 | #219 | Tragic 97.6% |
| Immigrants | Morocco | 5.0 /100 | #220 | Tragic 97.6% |
| Iraqis | 4.6 /100 | #221 | Tragic 97.6% |
| Immigrants | Sudan | 4.5 /100 | #222 | Tragic 97.6% |
| Sierra Leoneans | 4.3 /100 | #223 | Tragic 97.6% |
| Immigrants | Zaire | 4.3 /100 | #224 | Tragic 97.6% |
| Tongans | 4.3 /100 | #225 | Tragic 97.6% |
| Immigrants | Syria | 4.0 /100 | #226 | Tragic 97.6% |
| Immigrants | Nepal | 4.0 /100 | #227 | Tragic 97.6% |
| Sub-Saharan Africans | 3.4 /100 | #228 | Tragic 97.6% |
| Immigrants | Costa Rica | 3.1 /100 | #229 | Tragic 97.6% |
| Senegalese | 3.1 /100 | #230 | Tragic 97.6% |
| Immigrants | Pakistan | 2.3 /100 | #231 | Tragic 97.6% |
Demographics Similar to Jamaicans by 2nd Grade
In terms of 2nd grade, the demographic groups most similar to Jamaicans are Indian (Asian) (97.5%, a difference of 0.0%), Immigrants from Congo (97.5%, a difference of 0.0%), Immigrants from Colombia (97.5%, a difference of 0.0%), Yaqui (97.5%, a difference of 0.010%), and Fijian (97.5%, a difference of 0.010%).
| Demographics | Rating | Rank | 2nd Grade |
| Bolivians | 0.9 /100 | #249 | Tragic 97.5% |
| Peruvians | 0.9 /100 | #250 | Tragic 97.5% |
| Immigrants | Africa | 0.8 /100 | #251 | Tragic 97.5% |
| Immigrants | Asia | 0.7 /100 | #252 | Tragic 97.5% |
| Puerto Ricans | 0.7 /100 | #253 | Tragic 97.5% |
| Indians (Asian) | 0.6 /100 | #254 | Tragic 97.5% |
| Immigrants | Congo | 0.6 /100 | #255 | Tragic 97.5% |
| Jamaicans | 0.6 /100 | #256 | Tragic 97.5% |
| Immigrants | Colombia | 0.5 /100 | #257 | Tragic 97.5% |
| Yaqui | 0.5 /100 | #258 | Tragic 97.5% |
| Fijians | 0.5 /100 | #259 | Tragic 97.5% |
| Assyrians/Chaldeans/Syriacs | 0.5 /100 | #260 | Tragic 97.5% |
| Armenians | 0.5 /100 | #261 | Tragic 97.5% |
| Taiwanese | 0.4 /100 | #262 | Tragic 97.4% |
| Immigrants | Ethiopia | 0.4 /100 | #263 | Tragic 97.4% |