Austrian vs Chilean Median Earnings
COMPARE
Austrian
Chilean
Median Earnings
Median Earnings Comparison
Austrians
Chileans
$49,501
MEDIAN EARNINGS
98.7/ 100
METRIC RATING
103rd/ 347
METRIC RANK
$48,504
MEDIAN EARNINGS
94.8/ 100
METRIC RATING
122nd/ 347
METRIC RANK
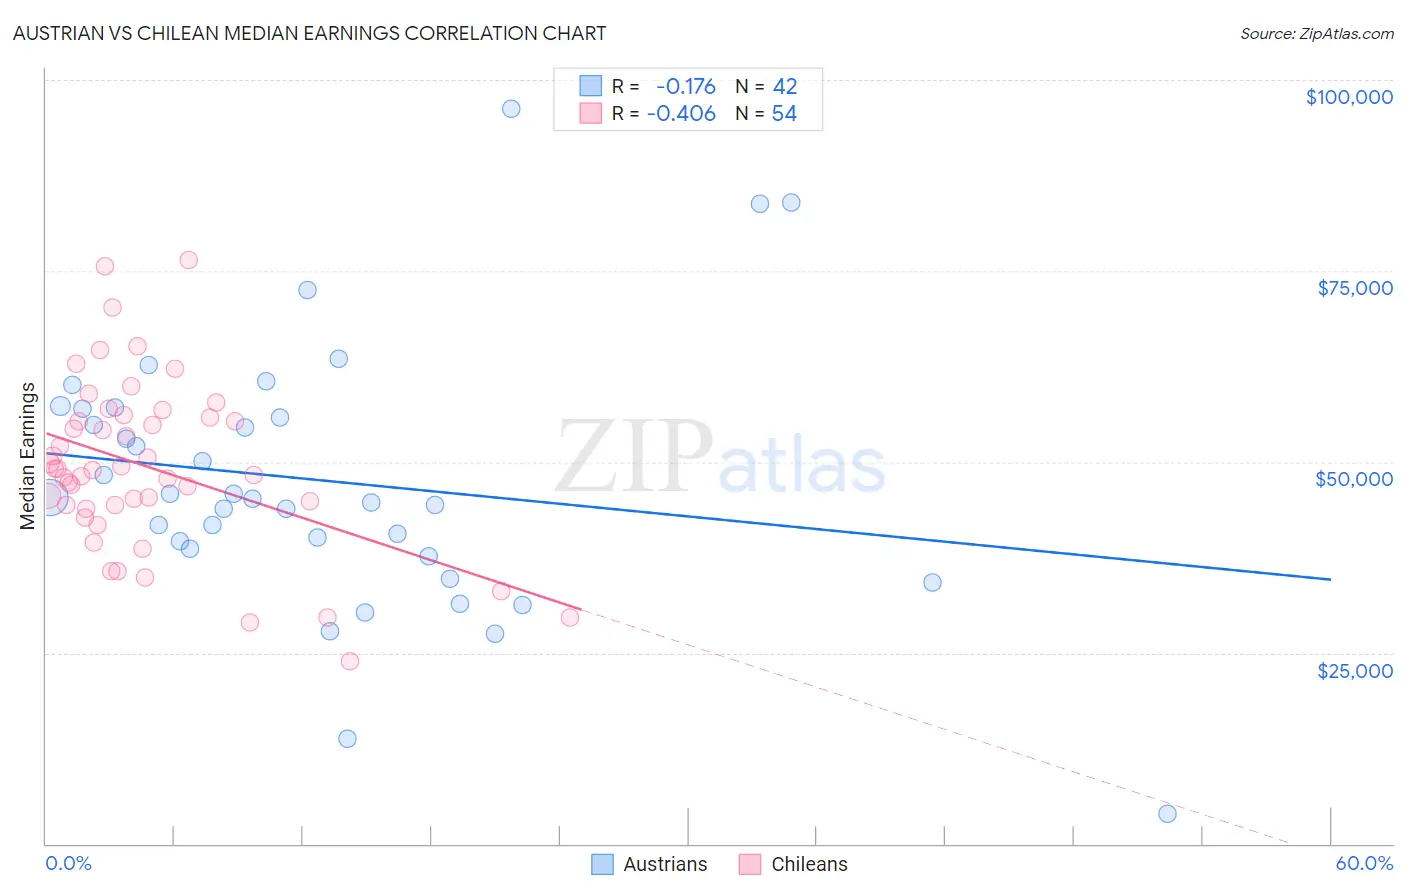
Austrian vs Chilean Median Earnings Correlation Chart
The statistical analysis conducted on geographies consisting of 452,042,983 people shows a poor negative correlation between the proportion of Austrians and median earnings in the United States with a correlation coefficient (R) of -0.176 and weighted average of $49,501. Similarly, the statistical analysis conducted on geographies consisting of 256,682,531 people shows a moderate negative correlation between the proportion of Chileans and median earnings in the United States with a correlation coefficient (R) of -0.406 and weighted average of $48,504, a difference of 2.1%.
Median Earnings Correlation Summary
| Measurement | Austrian | Chilean |
| Minimum | $3,902 | $23,911 |
| Maximum | $96,250 | $76,406 |
| Range | $92,348 | $52,495 |
| Mean | $47,542 | $49,382 |
| Median | $45,255 | $48,999 |
| Interquartile 25% (IQ1) | $38,609 | $44,321 |
| Interquartile 75% (IQ3) | $56,967 | $55,791 |
| Interquartile Range (IQR) | $18,358 | $11,470 |
| Standard Deviation (Sample) | $17,409 | $11,094 |
| Standard Deviation (Population) | $17,200 | $10,991 |
Demographics Similar to Austrians and Chileans by Median Earnings
In terms of median earnings, the demographic groups most similar to Austrians are Immigrants from Brazil ($49,463, a difference of 0.080%), Ethiopian ($49,572, a difference of 0.14%), Immigrants from Western Asia ($49,389, a difference of 0.23%), Immigrants from Albania ($49,377, a difference of 0.25%), and Immigrants from Morocco ($49,368, a difference of 0.27%). Similarly, the demographic groups most similar to Chileans are Arab ($48,599, a difference of 0.19%), Carpatho Rusyn ($48,617, a difference of 0.23%), Polish ($48,659, a difference of 0.32%), Immigrants from Jordan ($48,673, a difference of 0.35%), and Serbian ($48,677, a difference of 0.36%).
| Demographics | Rating | Rank | Median Earnings |
| Ethiopians | 98.8 /100 | #102 | Exceptional $49,572 |
| Austrians | 98.7 /100 | #103 | Exceptional $49,501 |
| Immigrants | Brazil | 98.6 /100 | #104 | Exceptional $49,463 |
| Immigrants | Western Asia | 98.4 /100 | #105 | Exceptional $49,389 |
| Immigrants | Albania | 98.4 /100 | #106 | Exceptional $49,377 |
| Immigrants | Morocco | 98.4 /100 | #107 | Exceptional $49,368 |
| Palestinians | 98.0 /100 | #108 | Exceptional $49,209 |
| Syrians | 97.1 /100 | #109 | Exceptional $48,934 |
| Immigrants | Ethiopia | 97.1 /100 | #110 | Exceptional $48,924 |
| Immigrants | Zimbabwe | 97.0 /100 | #111 | Exceptional $48,913 |
| Northern Europeans | 96.9 /100 | #112 | Exceptional $48,887 |
| Immigrants | Kuwait | 96.8 /100 | #113 | Exceptional $48,861 |
| Moroccans | 96.7 /100 | #114 | Exceptional $48,838 |
| Chinese | 96.7 /100 | #115 | Exceptional $48,836 |
| Koreans | 96.2 /100 | #116 | Exceptional $48,727 |
| Serbians | 95.9 /100 | #117 | Exceptional $48,677 |
| Immigrants | Jordan | 95.9 /100 | #118 | Exceptional $48,673 |
| Poles | 95.8 /100 | #119 | Exceptional $48,659 |
| Carpatho Rusyns | 95.5 /100 | #120 | Exceptional $48,617 |
| Arabs | 95.4 /100 | #121 | Exceptional $48,599 |
| Chileans | 94.8 /100 | #122 | Exceptional $48,504 |