Immigrants from Uruguay vs Eastern European Median Household Income
COMPARE
Immigrants from Uruguay
Eastern European
Median Household Income
Median Household Income Comparison
Immigrants from Uruguay
Eastern Europeans
$82,560
MEDIAN HOUSEHOLD INCOME
16.4/ 100
METRIC RATING
210th/ 347
METRIC RANK
$101,781
MEDIAN HOUSEHOLD INCOME
100.0/ 100
METRIC RATING
21st/ 347
METRIC RANK
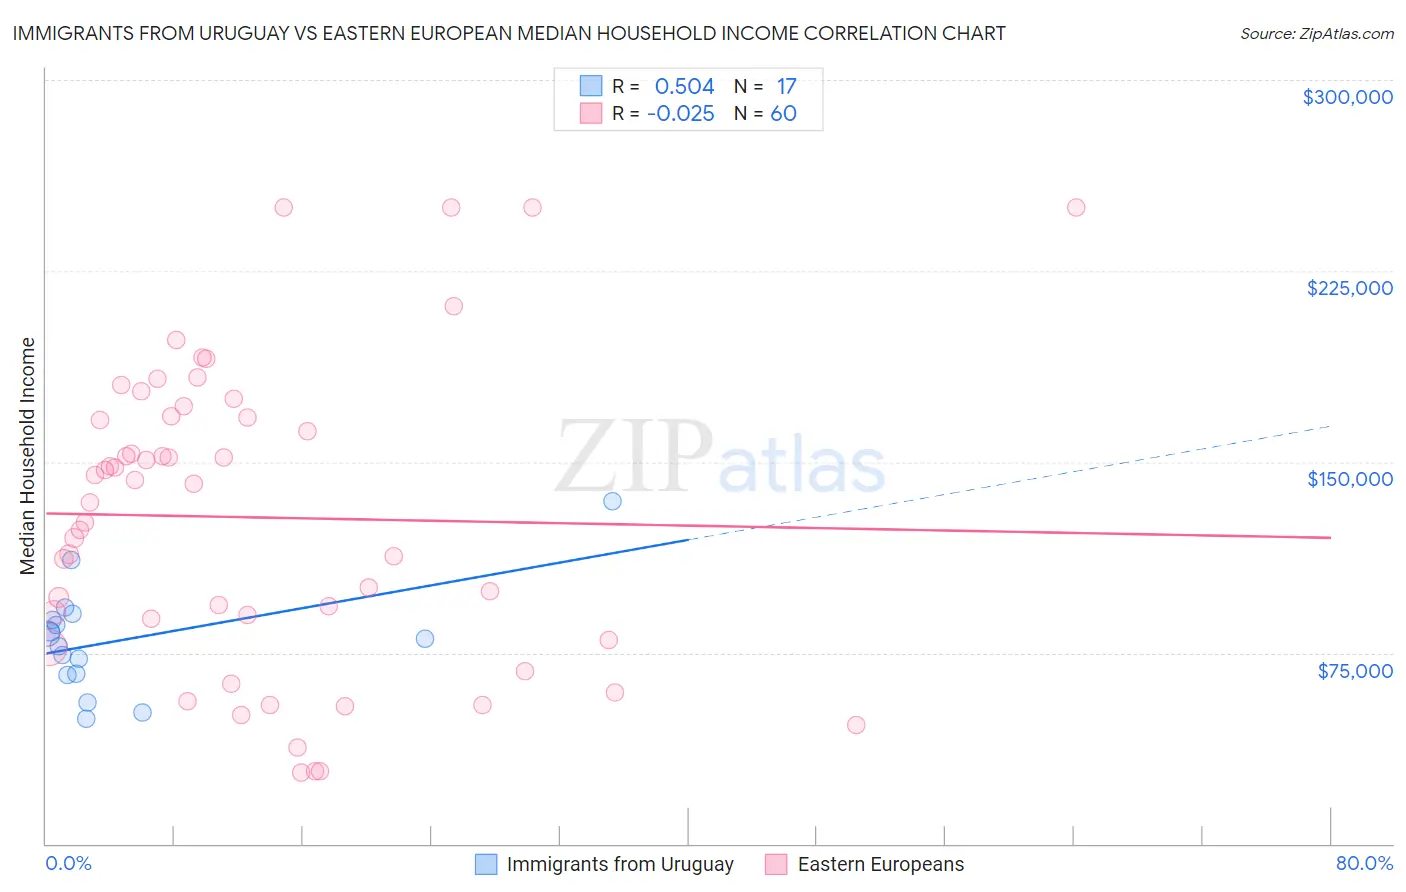
Immigrants from Uruguay vs Eastern European Median Household Income Correlation Chart
The statistical analysis conducted on geographies consisting of 133,237,976 people shows a substantial positive correlation between the proportion of Immigrants from Uruguay and median household income in the United States with a correlation coefficient (R) of 0.504 and weighted average of $82,560. Similarly, the statistical analysis conducted on geographies consisting of 460,842,192 people shows no correlation between the proportion of Eastern Europeans and median household income in the United States with a correlation coefficient (R) of -0.025 and weighted average of $101,781, a difference of 23.3%.
Median Household Income Correlation Summary
| Measurement | Immigrants from Uruguay | Eastern European |
| Minimum | $49,241 | $28,140 |
| Maximum | $134,635 | $250,001 |
| Range | $85,394 | $221,861 |
| Mean | $80,181 | $128,179 |
| Median | $80,417 | $137,749 |
| Interquartile 25% (IQ1) | $66,523 | $84,285 |
| Interquartile 75% (IQ3) | $89,275 | $167,660 |
| Interquartile Range (IQR) | $22,752 | $83,375 |
| Standard Deviation (Sample) | $21,157 | $58,971 |
| Standard Deviation (Population) | $20,525 | $58,477 |
Similar Demographics by Median Household Income
Demographics Similar to Immigrants from Uruguay by Median Household Income
In terms of median household income, the demographic groups most similar to Immigrants from Uruguay are Immigrants from Iraq ($82,594, a difference of 0.040%), Salvadoran ($82,449, a difference of 0.14%), Venezuelan ($82,432, a difference of 0.16%), Nepalese ($82,410, a difference of 0.18%), and French Canadian ($82,810, a difference of 0.30%).
| Demographics | Rating | Rank | Median Household Income |
| Immigrants | Cambodia | 24.0 /100 | #203 | Fair $83,304 |
| Immigrants | Africa | 23.8 /100 | #204 | Fair $83,289 |
| Celtics | 22.7 /100 | #205 | Fair $83,193 |
| Immigrants | Kenya | 21.3 /100 | #206 | Fair $83,068 |
| Dutch | 20.3 /100 | #207 | Fair $82,971 |
| French Canadians | 18.7 /100 | #208 | Poor $82,810 |
| Immigrants | Iraq | 16.7 /100 | #209 | Poor $82,594 |
| Immigrants | Uruguay | 16.4 /100 | #210 | Poor $82,560 |
| Salvadorans | 15.4 /100 | #211 | Poor $82,449 |
| Venezuelans | 15.3 /100 | #212 | Poor $82,432 |
| Nepalese | 15.1 /100 | #213 | Poor $82,410 |
| Panamanians | 14.0 /100 | #214 | Poor $82,272 |
| Vietnamese | 13.8 /100 | #215 | Poor $82,248 |
| Yugoslavians | 13.3 /100 | #216 | Poor $82,186 |
| Ecuadorians | 12.5 /100 | #217 | Poor $82,070 |
Demographics Similar to Eastern Europeans by Median Household Income
In terms of median household income, the demographic groups most similar to Eastern Europeans are Asian ($101,681, a difference of 0.10%), Immigrants from Bolivia ($101,394, a difference of 0.38%), Bolivian ($102,195, a difference of 0.41%), Immigrants from Australia ($102,562, a difference of 0.77%), and Cypriot ($102,843, a difference of 1.0%).
| Demographics | Rating | Rank | Median Household Income |
| Immigrants | Ireland | 100.0 /100 | #14 | Exceptional $104,692 |
| Immigrants | Israel | 100.0 /100 | #15 | Exceptional $104,090 |
| Burmese | 100.0 /100 | #16 | Exceptional $103,145 |
| Immigrants | Korea | 100.0 /100 | #17 | Exceptional $102,962 |
| Cypriots | 100.0 /100 | #18 | Exceptional $102,843 |
| Immigrants | Australia | 100.0 /100 | #19 | Exceptional $102,562 |
| Bolivians | 100.0 /100 | #20 | Exceptional $102,195 |
| Eastern Europeans | 100.0 /100 | #21 | Exceptional $101,781 |
| Asians | 100.0 /100 | #22 | Exceptional $101,681 |
| Immigrants | Bolivia | 100.0 /100 | #23 | Exceptional $101,394 |
| Immigrants | Japan | 100.0 /100 | #24 | Exceptional $100,711 |
| Immigrants | Sweden | 100.0 /100 | #25 | Exceptional $100,699 |
| Immigrants | Belgium | 100.0 /100 | #26 | Exceptional $100,306 |
| Bhutanese | 100.0 /100 | #27 | Exceptional $100,151 |
| Immigrants | Sri Lanka | 100.0 /100 | #28 | Exceptional $99,943 |