Immigrants from Uruguay vs Immigrants from Mexico Median Family Income
COMPARE
Immigrants from Uruguay
Immigrants from Mexico
Median Family Income
Median Family Income Comparison
Immigrants from Uruguay
Immigrants from Mexico
$98,205
MEDIAN FAMILY INCOME
9.2/ 100
METRIC RATING
208th/ 347
METRIC RANK
$83,639
MEDIAN FAMILY INCOME
0.0/ 100
METRIC RATING
318th/ 347
METRIC RANK
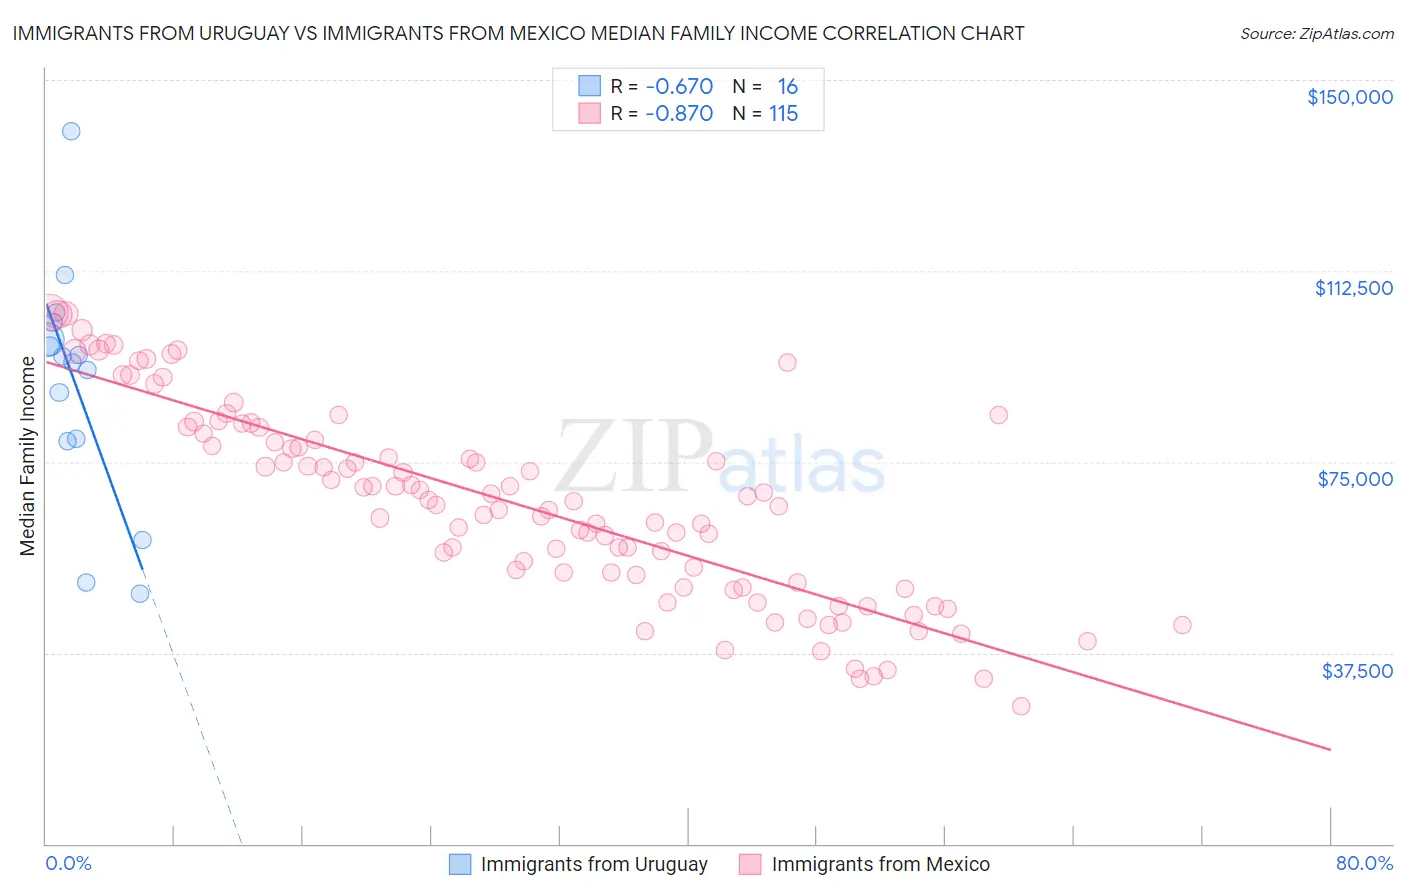
Immigrants from Uruguay vs Immigrants from Mexico Median Family Income Correlation Chart
The statistical analysis conducted on geographies consisting of 133,244,863 people shows a significant negative correlation between the proportion of Immigrants from Uruguay and median family income in the United States with a correlation coefficient (R) of -0.670 and weighted average of $98,205. Similarly, the statistical analysis conducted on geographies consisting of 512,958,720 people shows a very strong negative correlation between the proportion of Immigrants from Mexico and median family income in the United States with a correlation coefficient (R) of -0.870 and weighted average of $83,639, a difference of 17.4%.
Median Family Income Correlation Summary
| Measurement | Immigrants from Uruguay | Immigrants from Mexico |
| Minimum | $49,007 | $27,125 |
| Maximum | $139,969 | $104,446 |
| Range | $90,962 | $77,321 |
| Mean | $90,062 | $66,857 |
| Median | $95,116 | $67,328 |
| Interquartile 25% (IQ1) | $79,263 | $51,313 |
| Interquartile 75% (IQ3) | $100,653 | $80,504 |
| Interquartile Range (IQR) | $21,390 | $29,191 |
| Standard Deviation (Sample) | $22,948 | $19,043 |
| Standard Deviation (Population) | $22,219 | $18,960 |
Similar Demographics by Median Family Income
Demographics Similar to Immigrants from Uruguay by Median Family Income
In terms of median family income, the demographic groups most similar to Immigrants from Uruguay are Immigrants from Colombia ($98,067, a difference of 0.14%), Puget Sound Salish ($97,958, a difference of 0.25%), Immigrants from Sudan ($97,737, a difference of 0.48%), Aleut ($98,702, a difference of 0.51%), and Panamanian ($97,683, a difference of 0.53%).
| Demographics | Rating | Rank | Median Family Income |
| Immigrants | Thailand | 19.0 /100 | #201 | Poor $99,840 |
| Whites/Caucasians | 18.7 /100 | #202 | Poor $99,800 |
| Scotch-Irish | 17.1 /100 | #203 | Poor $99,591 |
| Ghanaians | 12.6 /100 | #204 | Poor $98,877 |
| Hawaiians | 12.5 /100 | #205 | Poor $98,869 |
| Immigrants | Iraq | 12.1 /100 | #206 | Poor $98,786 |
| Aleuts | 11.6 /100 | #207 | Poor $98,702 |
| Immigrants | Uruguay | 9.2 /100 | #208 | Tragic $98,205 |
| Immigrants | Colombia | 8.7 /100 | #209 | Tragic $98,067 |
| Puget Sound Salish | 8.2 /100 | #210 | Tragic $97,958 |
| Immigrants | Sudan | 7.4 /100 | #211 | Tragic $97,737 |
| Panamanians | 7.2 /100 | #212 | Tragic $97,683 |
| Immigrants | Armenia | 7.0 /100 | #213 | Tragic $97,605 |
| Bermudans | 6.9 /100 | #214 | Tragic $97,577 |
| Nigerians | 6.7 /100 | #215 | Tragic $97,522 |
Demographics Similar to Immigrants from Mexico by Median Family Income
In terms of median family income, the demographic groups most similar to Immigrants from Mexico are Immigrants from Honduras ($83,618, a difference of 0.030%), Seminole ($83,354, a difference of 0.34%), Yakama ($83,932, a difference of 0.35%), Immigrants from Caribbean ($83,319, a difference of 0.38%), and Immigrants from Haiti ($84,018, a difference of 0.45%).
| Demographics | Rating | Rank | Median Family Income |
| Hondurans | 0.0 /100 | #311 | Tragic $85,004 |
| Cubans | 0.0 /100 | #312 | Tragic $84,981 |
| Choctaw | 0.0 /100 | #313 | Tragic $84,835 |
| Immigrants | Bahamas | 0.0 /100 | #314 | Tragic $84,732 |
| Apache | 0.0 /100 | #315 | Tragic $84,451 |
| Immigrants | Haiti | 0.0 /100 | #316 | Tragic $84,018 |
| Yakama | 0.0 /100 | #317 | Tragic $83,932 |
| Immigrants | Mexico | 0.0 /100 | #318 | Tragic $83,639 |
| Immigrants | Honduras | 0.0 /100 | #319 | Tragic $83,618 |
| Seminole | 0.0 /100 | #320 | Tragic $83,354 |
| Immigrants | Caribbean | 0.0 /100 | #321 | Tragic $83,319 |
| Dominicans | 0.0 /100 | #322 | Tragic $82,888 |
| Bahamians | 0.0 /100 | #323 | Tragic $82,631 |
| Creek | 0.0 /100 | #324 | Tragic $82,560 |
| Sioux | 0.0 /100 | #325 | Tragic $82,386 |