Immigrants from Uruguay vs Immigrants from Mexico In Labor Force | Age 16-19
COMPARE
Immigrants from Uruguay
Immigrants from Mexico
In Labor Force | Age 16-19
In Labor Force | Age 16-19 Comparison
Immigrants from Uruguay
Immigrants from Mexico
34.4%
IN LABOR FORCE | AGE 16-19
0.9/ 100
METRIC RATING
264th/ 347
METRIC RANK
35.1%
IN LABOR FORCE | AGE 16-19
4.2/ 100
METRIC RATING
234th/ 347
METRIC RANK
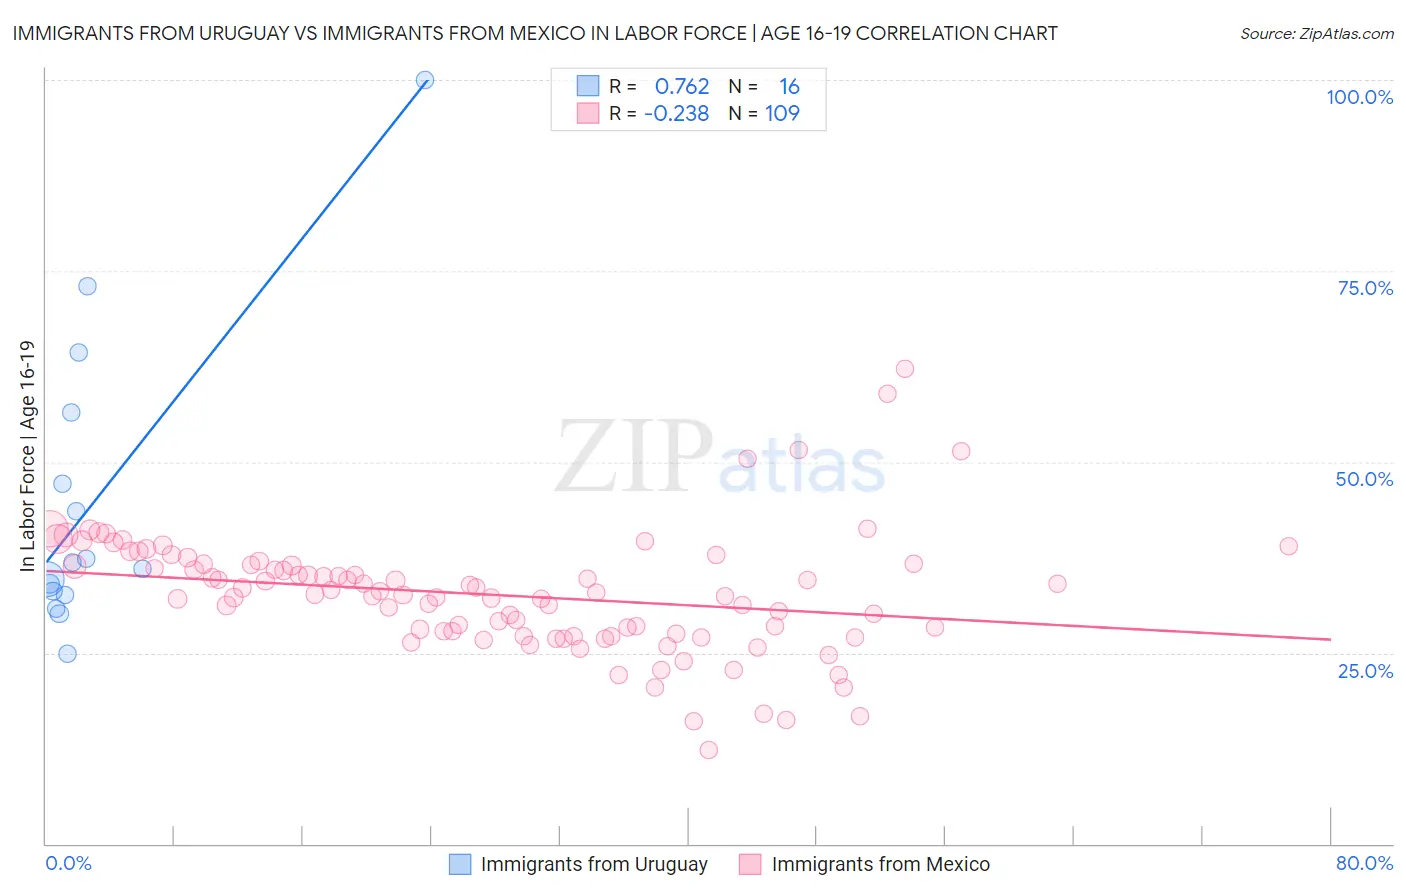
Immigrants from Uruguay vs Immigrants from Mexico In Labor Force | Age 16-19 Correlation Chart
The statistical analysis conducted on geographies consisting of 133,181,589 people shows a strong positive correlation between the proportion of Immigrants from Uruguay and labor force participation rate among population between the ages 16 and 19 in the United States with a correlation coefficient (R) of 0.762 and weighted average of 34.4%. Similarly, the statistical analysis conducted on geographies consisting of 511,656,414 people shows a weak negative correlation between the proportion of Immigrants from Mexico and labor force participation rate among population between the ages 16 and 19 in the United States with a correlation coefficient (R) of -0.238 and weighted average of 35.1%, a difference of 2.1%.
In Labor Force | Age 16-19 Correlation Summary
| Measurement | Immigrants from Uruguay | Immigrants from Mexico |
| Minimum | 24.8% | 12.3% |
| Maximum | 100.0% | 62.2% |
| Range | 75.2% | 49.9% |
| Mean | 44.7% | 32.6% |
| Median | 36.4% | 32.7% |
| Interquartile 25% (IQ1) | 32.8% | 27.4% |
| Interquartile 75% (IQ3) | 51.8% | 36.5% |
| Interquartile Range (IQR) | 19.0% | 9.1% |
| Standard Deviation (Sample) | 19.8% | 7.9% |
| Standard Deviation (Population) | 19.2% | 7.9% |
Similar Demographics by In Labor Force | Age 16-19
Demographics Similar to Immigrants from Uruguay by In Labor Force | Age 16-19
In terms of in labor force | age 16-19, the demographic groups most similar to Immigrants from Uruguay are Immigrants from El Salvador (34.3%, a difference of 0.24%), Burmese (34.5%, a difference of 0.28%), Hispanic or Latino (34.5%, a difference of 0.32%), Salvadoran (34.5%, a difference of 0.33%), and Immigrants from Malaysia (34.3%, a difference of 0.33%).
| Demographics | Rating | Rank | In Labor Force | Age 16-19 |
| Immigrants | Egypt | 1.2 /100 | #257 | Tragic 34.6% |
| Thais | 1.2 /100 | #258 | Tragic 34.6% |
| Immigrants | Immigrants | 1.2 /100 | #259 | Tragic 34.6% |
| Egyptians | 1.2 /100 | #260 | Tragic 34.5% |
| Salvadorans | 1.1 /100 | #261 | Tragic 34.5% |
| Hispanics or Latinos | 1.1 /100 | #262 | Tragic 34.5% |
| Burmese | 1.1 /100 | #263 | Tragic 34.5% |
| Immigrants | Uruguay | 0.9 /100 | #264 | Tragic 34.4% |
| Immigrants | El Salvador | 0.7 /100 | #265 | Tragic 34.3% |
| Immigrants | Malaysia | 0.7 /100 | #266 | Tragic 34.3% |
| Immigrants | Peru | 0.5 /100 | #267 | Tragic 34.2% |
| Immigrants | Asia | 0.5 /100 | #268 | Tragic 34.1% |
| Pima | 0.5 /100 | #269 | Tragic 34.1% |
| Immigrants | Russia | 0.4 /100 | #270 | Tragic 34.1% |
| Central American Indians | 0.4 /100 | #271 | Tragic 34.1% |
Demographics Similar to Immigrants from Mexico by In Labor Force | Age 16-19
In terms of in labor force | age 16-19, the demographic groups most similar to Immigrants from Mexico are Immigrants from France (35.1%, a difference of 0.040%), Immigrants from Syria (35.2%, a difference of 0.080%), Immigrants from Kazakhstan (35.2%, a difference of 0.080%), Immigrants from Philippines (35.1%, a difference of 0.080%), and Immigrants from Honduras (35.2%, a difference of 0.20%).
| Demographics | Rating | Rank | In Labor Force | Age 16-19 |
| Mongolians | 5.7 /100 | #227 | Tragic 35.3% |
| Immigrants | Senegal | 5.5 /100 | #228 | Tragic 35.3% |
| Immigrants | Lebanon | 5.0 /100 | #229 | Tragic 35.2% |
| Immigrants | Honduras | 4.9 /100 | #230 | Tragic 35.2% |
| Immigrants | Syria | 4.5 /100 | #231 | Tragic 35.2% |
| Immigrants | Kazakhstan | 4.5 /100 | #232 | Tragic 35.2% |
| Immigrants | France | 4.3 /100 | #233 | Tragic 35.1% |
| Immigrants | Mexico | 4.2 /100 | #234 | Tragic 35.1% |
| Immigrants | Philippines | 4.0 /100 | #235 | Tragic 35.1% |
| Immigrants | Australia | 3.6 /100 | #236 | Tragic 35.1% |
| Immigrants | India | 3.5 /100 | #237 | Tragic 35.0% |
| Immigrants | Vietnam | 3.4 /100 | #238 | Tragic 35.0% |
| Inupiat | 3.2 /100 | #239 | Tragic 35.0% |
| Immigrants | Central America | 3.0 /100 | #240 | Tragic 35.0% |
| Immigrants | Ireland | 2.9 /100 | #241 | Tragic 35.0% |