Immigrants from Uganda vs Immigrants from Iran Median Earnings
COMPARE
Immigrants from Uganda
Immigrants from Iran
Median Earnings
Median Earnings Comparison
Immigrants from Uganda
Immigrants from Iran
$48,041
MEDIAN EARNINGS
90.5/ 100
METRIC RATING
133rd/ 347
METRIC RANK
$57,612
MEDIAN EARNINGS
100.0/ 100
METRIC RATING
8th/ 347
METRIC RANK
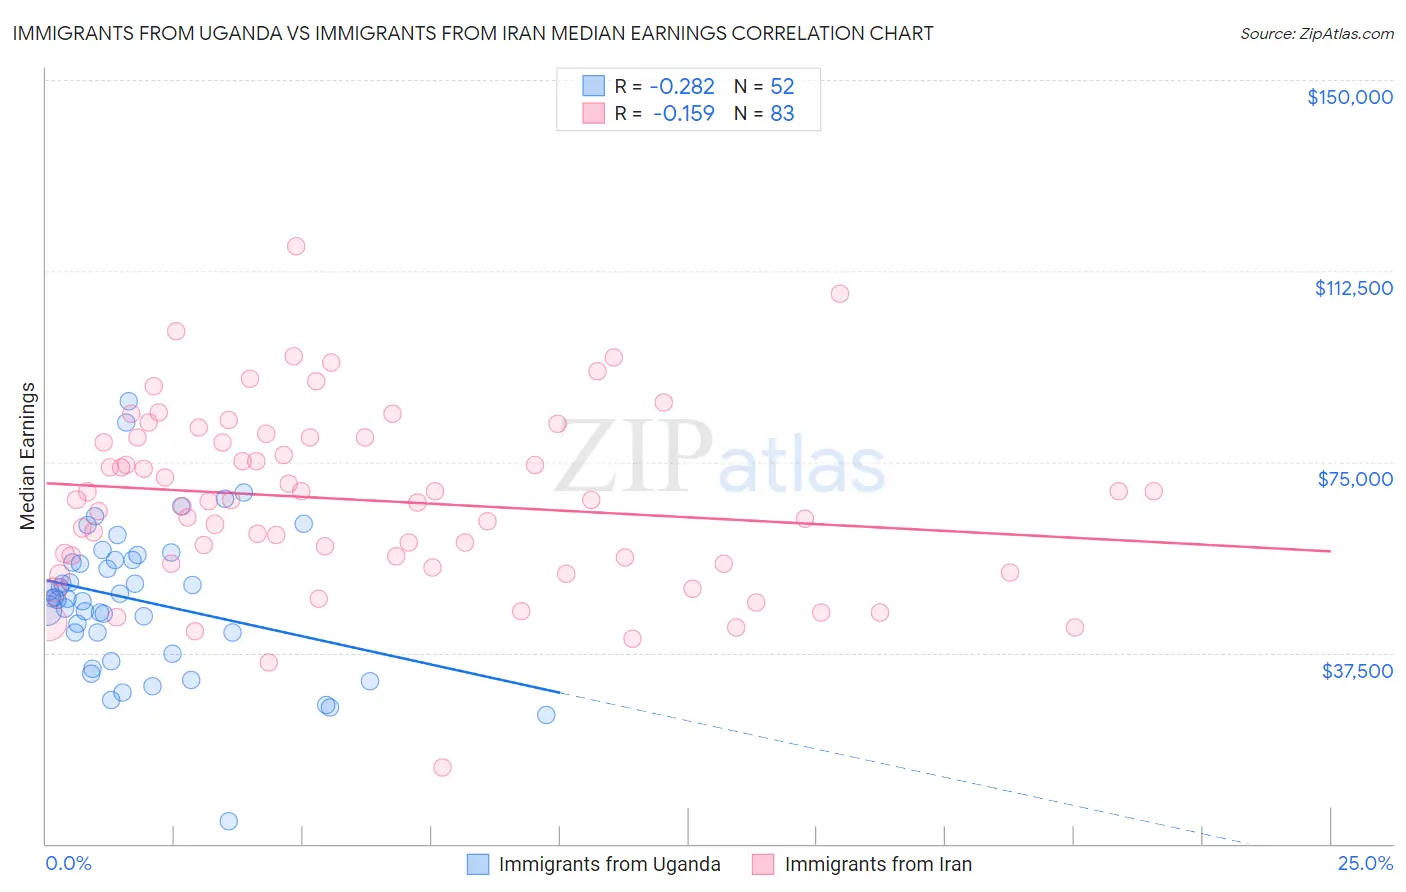
Immigrants from Uganda vs Immigrants from Iran Median Earnings Correlation Chart
The statistical analysis conducted on geographies consisting of 125,980,560 people shows a weak negative correlation between the proportion of Immigrants from Uganda and median earnings in the United States with a correlation coefficient (R) of -0.282 and weighted average of $48,041. Similarly, the statistical analysis conducted on geographies consisting of 279,892,133 people shows a poor negative correlation between the proportion of Immigrants from Iran and median earnings in the United States with a correlation coefficient (R) of -0.159 and weighted average of $57,612, a difference of 19.9%.
Median Earnings Correlation Summary
| Measurement | Immigrants from Uganda | Immigrants from Iran |
| Minimum | $4,426 | $14,861 |
| Maximum | $87,021 | $117,429 |
| Range | $82,595 | $102,568 |
| Mean | $47,722 | $67,470 |
| Median | $48,140 | $67,500 |
| Interquartile 25% (IQ1) | $39,326 | $54,982 |
| Interquartile 75% (IQ3) | $55,755 | $79,813 |
| Interquartile Range (IQR) | $16,429 | $24,831 |
| Standard Deviation (Sample) | $14,671 | $17,753 |
| Standard Deviation (Population) | $14,529 | $17,645 |
Similar Demographics by Median Earnings
Demographics Similar to Immigrants from Uganda by Median Earnings
In terms of median earnings, the demographic groups most similar to Immigrants from Uganda are Sri Lankan ($48,040, a difference of 0.0%), Portuguese ($48,032, a difference of 0.020%), Slovene ($47,995, a difference of 0.10%), Immigrants from Nepal ($47,925, a difference of 0.24%), and European ($47,915, a difference of 0.26%).
| Demographics | Rating | Rank | Median Earnings |
| Assyrians/Chaldeans/Syriacs | 93.3 /100 | #126 | Exceptional $48,304 |
| Sierra Leoneans | 93.1 /100 | #127 | Exceptional $48,286 |
| Immigrants | Philippines | 92.9 /100 | #128 | Exceptional $48,266 |
| Pakistanis | 92.8 /100 | #129 | Exceptional $48,254 |
| Zimbabweans | 92.6 /100 | #130 | Exceptional $48,229 |
| Lebanese | 92.5 /100 | #131 | Exceptional $48,226 |
| British | 92.2 /100 | #132 | Exceptional $48,189 |
| Immigrants | Uganda | 90.5 /100 | #133 | Exceptional $48,041 |
| Sri Lankans | 90.5 /100 | #134 | Exceptional $48,040 |
| Portuguese | 90.4 /100 | #135 | Exceptional $48,032 |
| Slovenes | 90.0 /100 | #136 | Excellent $47,995 |
| Immigrants | Nepal | 89.0 /100 | #137 | Excellent $47,925 |
| Europeans | 88.9 /100 | #138 | Excellent $47,915 |
| Canadians | 88.8 /100 | #139 | Excellent $47,911 |
| Taiwanese | 88.7 /100 | #140 | Excellent $47,902 |
Demographics Similar to Immigrants from Iran by Median Earnings
In terms of median earnings, the demographic groups most similar to Immigrants from Iran are Okinawan ($57,550, a difference of 0.11%), Immigrants from South Central Asia ($57,114, a difference of 0.87%), Immigrants from Israel ($57,034, a difference of 1.0%), Immigrants from Ireland ($56,854, a difference of 1.3%), and Iranian ($58,474, a difference of 1.5%).
| Demographics | Rating | Rank | Median Earnings |
| Filipinos | 100.0 /100 | #1 | Exceptional $61,197 |
| Immigrants | Taiwan | 100.0 /100 | #2 | Exceptional $61,151 |
| Immigrants | India | 100.0 /100 | #3 | Exceptional $60,648 |
| Immigrants | Hong Kong | 100.0 /100 | #4 | Exceptional $59,433 |
| Thais | 100.0 /100 | #5 | Exceptional $59,237 |
| Immigrants | Singapore | 100.0 /100 | #6 | Exceptional $59,038 |
| Iranians | 100.0 /100 | #7 | Exceptional $58,474 |
| Immigrants | Iran | 100.0 /100 | #8 | Exceptional $57,612 |
| Okinawans | 100.0 /100 | #9 | Exceptional $57,550 |
| Immigrants | South Central Asia | 100.0 /100 | #10 | Exceptional $57,114 |
| Immigrants | Israel | 100.0 /100 | #11 | Exceptional $57,034 |
| Immigrants | Ireland | 100.0 /100 | #12 | Exceptional $56,854 |
| Immigrants | China | 100.0 /100 | #13 | Exceptional $56,638 |
| Immigrants | Australia | 100.0 /100 | #14 | Exceptional $56,305 |
| Indians (Asian) | 100.0 /100 | #15 | Exceptional $56,253 |