Immigrants from Uganda vs Barbadian Median Earnings
COMPARE
Immigrants from Uganda
Barbadian
Median Earnings
Median Earnings Comparison
Immigrants from Uganda
Barbadians
$48,041
MEDIAN EARNINGS
90.5/ 100
METRIC RATING
133rd/ 347
METRIC RANK
$45,846
MEDIAN EARNINGS
30.5/ 100
METRIC RATING
197th/ 347
METRIC RANK
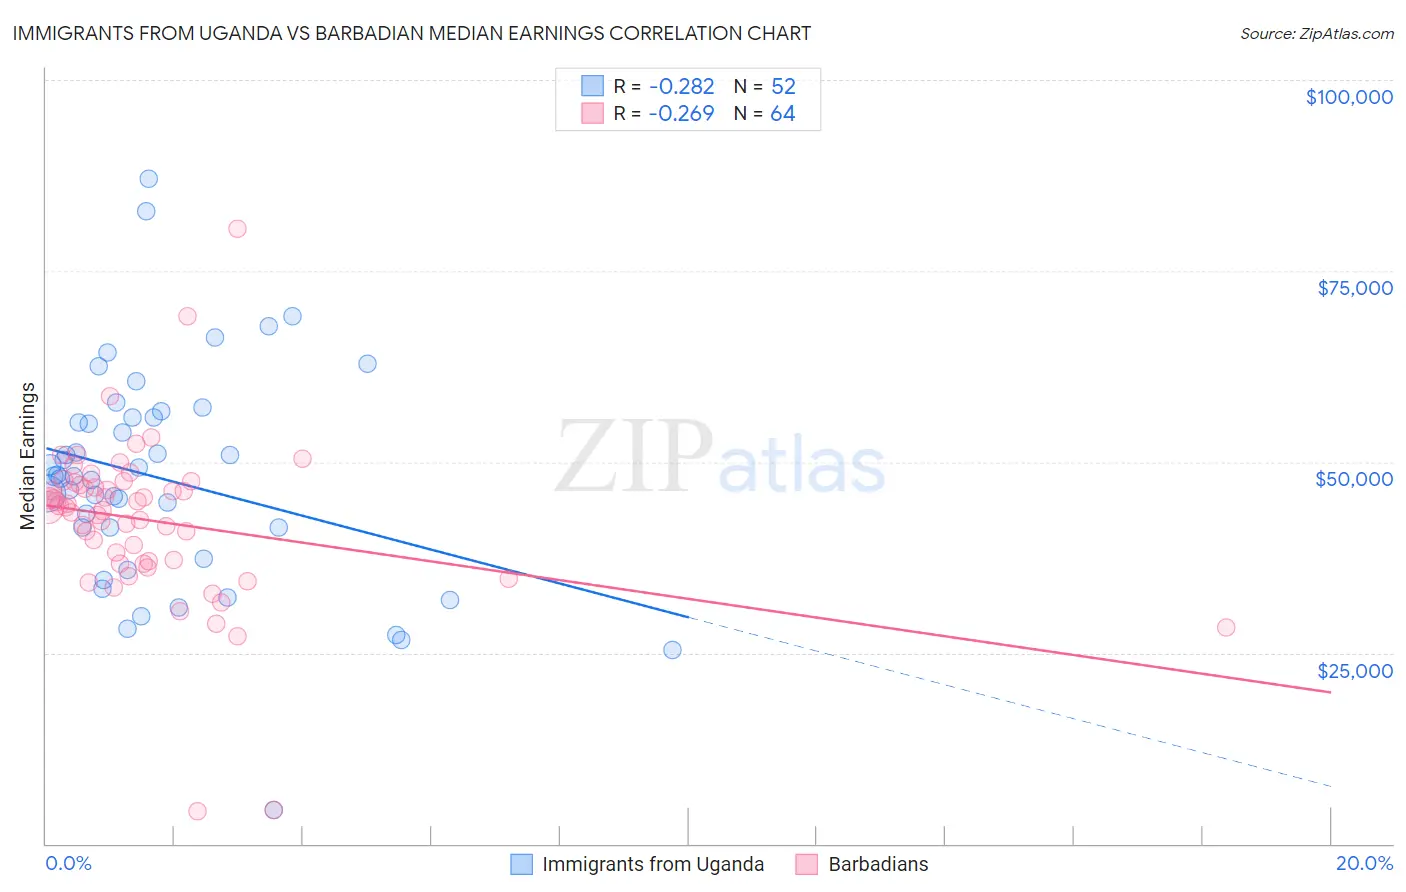
Immigrants from Uganda vs Barbadian Median Earnings Correlation Chart
The statistical analysis conducted on geographies consisting of 125,980,560 people shows a weak negative correlation between the proportion of Immigrants from Uganda and median earnings in the United States with a correlation coefficient (R) of -0.282 and weighted average of $48,041. Similarly, the statistical analysis conducted on geographies consisting of 141,267,085 people shows a weak negative correlation between the proportion of Barbadians and median earnings in the United States with a correlation coefficient (R) of -0.269 and weighted average of $45,846, a difference of 4.8%.
Median Earnings Correlation Summary
| Measurement | Immigrants from Uganda | Barbadian |
| Minimum | $4,426 | $4,250 |
| Maximum | $87,021 | $80,575 |
| Range | $82,595 | $76,325 |
| Mean | $47,722 | $42,285 |
| Median | $48,140 | $44,059 |
| Interquartile 25% (IQ1) | $39,326 | $36,766 |
| Interquartile 75% (IQ3) | $55,755 | $47,124 |
| Interquartile Range (IQR) | $16,429 | $10,358 |
| Standard Deviation (Sample) | $14,671 | $11,063 |
| Standard Deviation (Population) | $14,529 | $10,976 |
Similar Demographics by Median Earnings
Demographics Similar to Immigrants from Uganda by Median Earnings
In terms of median earnings, the demographic groups most similar to Immigrants from Uganda are Sri Lankan ($48,040, a difference of 0.0%), Portuguese ($48,032, a difference of 0.020%), Slovene ($47,995, a difference of 0.10%), Immigrants from Nepal ($47,925, a difference of 0.24%), and European ($47,915, a difference of 0.26%).
| Demographics | Rating | Rank | Median Earnings |
| Assyrians/Chaldeans/Syriacs | 93.3 /100 | #126 | Exceptional $48,304 |
| Sierra Leoneans | 93.1 /100 | #127 | Exceptional $48,286 |
| Immigrants | Philippines | 92.9 /100 | #128 | Exceptional $48,266 |
| Pakistanis | 92.8 /100 | #129 | Exceptional $48,254 |
| Zimbabweans | 92.6 /100 | #130 | Exceptional $48,229 |
| Lebanese | 92.5 /100 | #131 | Exceptional $48,226 |
| British | 92.2 /100 | #132 | Exceptional $48,189 |
| Immigrants | Uganda | 90.5 /100 | #133 | Exceptional $48,041 |
| Sri Lankans | 90.5 /100 | #134 | Exceptional $48,040 |
| Portuguese | 90.4 /100 | #135 | Exceptional $48,032 |
| Slovenes | 90.0 /100 | #136 | Excellent $47,995 |
| Immigrants | Nepal | 89.0 /100 | #137 | Excellent $47,925 |
| Europeans | 88.9 /100 | #138 | Excellent $47,915 |
| Canadians | 88.8 /100 | #139 | Excellent $47,911 |
| Taiwanese | 88.7 /100 | #140 | Excellent $47,902 |
Demographics Similar to Barbadians by Median Earnings
In terms of median earnings, the demographic groups most similar to Barbadians are Yugoslavian ($45,846, a difference of 0.0%), Trinidadian and Tobagonian ($45,820, a difference of 0.060%), Immigrants from Barbados ($45,816, a difference of 0.060%), Immigrants from the Azores ($45,812, a difference of 0.070%), and Immigrants from St. Vincent and the Grenadines ($45,908, a difference of 0.14%).
| Demographics | Rating | Rank | Median Earnings |
| French Canadians | 36.1 /100 | #190 | Fair $46,026 |
| Finns | 33.4 /100 | #191 | Fair $45,940 |
| Germans | 33.2 /100 | #192 | Fair $45,935 |
| Guamanians/Chamorros | 33.2 /100 | #193 | Fair $45,933 |
| Immigrants | Costa Rica | 33.0 /100 | #194 | Fair $45,928 |
| Immigrants | St. Vincent and the Grenadines | 32.4 /100 | #195 | Fair $45,908 |
| Yugoslavians | 30.5 /100 | #196 | Fair $45,846 |
| Barbadians | 30.5 /100 | #197 | Fair $45,846 |
| Trinidadians and Tobagonians | 29.7 /100 | #198 | Fair $45,820 |
| Immigrants | Barbados | 29.6 /100 | #199 | Fair $45,816 |
| Immigrants | Azores | 29.5 /100 | #200 | Fair $45,812 |
| Celtics | 27.2 /100 | #201 | Fair $45,732 |
| Immigrants | Trinidad and Tobago | 27.1 /100 | #202 | Fair $45,729 |
| Welsh | 26.6 /100 | #203 | Fair $45,710 |
| Immigrants | Uruguay | 25.9 /100 | #204 | Fair $45,682 |