Immigrants from Haiti vs Immigrants from Iran Median Earnings
COMPARE
Immigrants from Haiti
Immigrants from Iran
Median Earnings
Median Earnings Comparison
Immigrants from Haiti
Immigrants from Iran
$40,550
MEDIAN EARNINGS
0.0/ 100
METRIC RATING
309th/ 347
METRIC RANK
$57,612
MEDIAN EARNINGS
100.0/ 100
METRIC RATING
8th/ 347
METRIC RANK
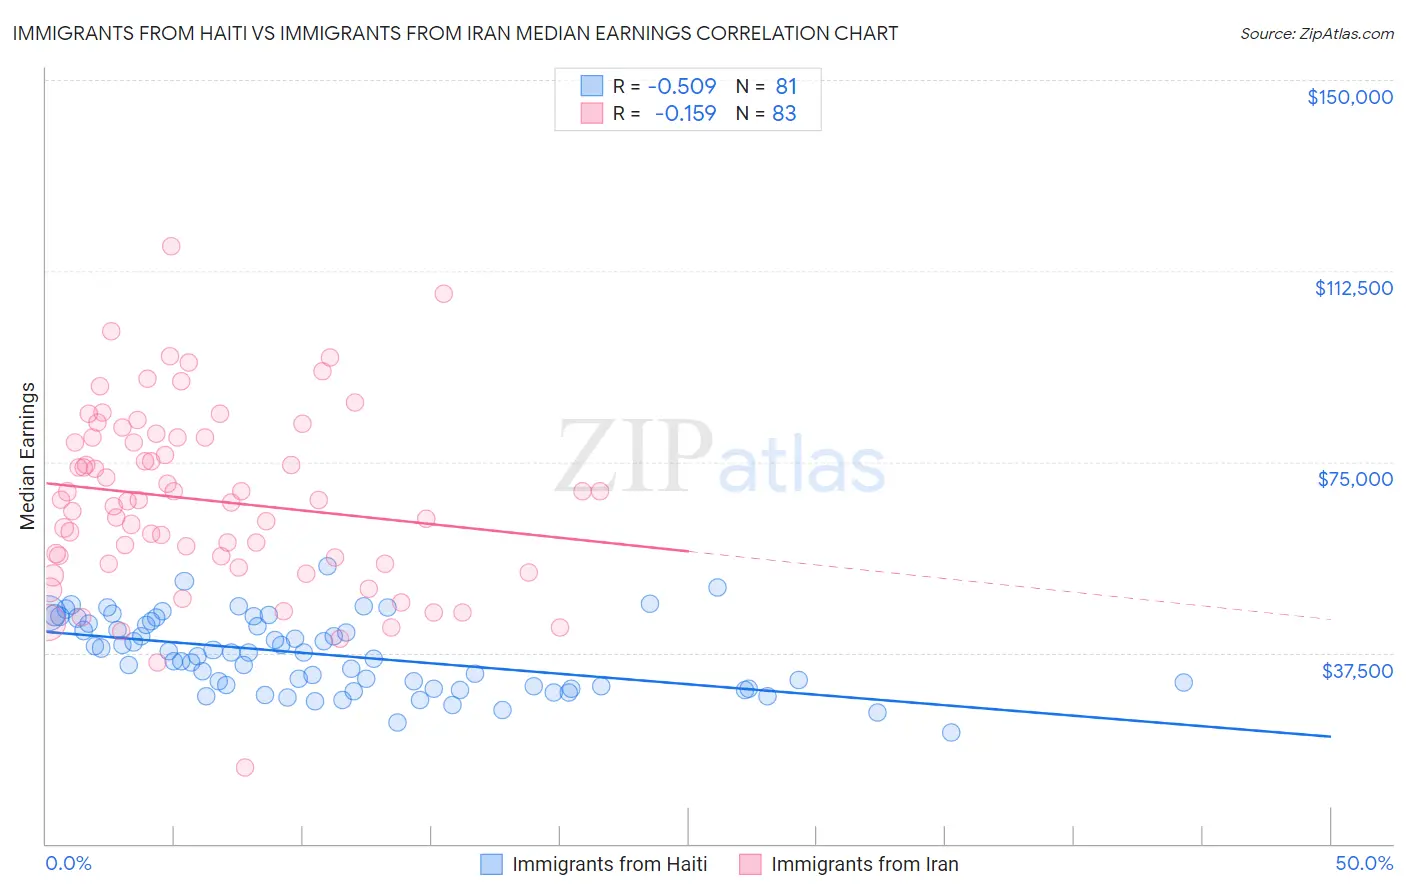
Immigrants from Haiti vs Immigrants from Iran Median Earnings Correlation Chart
The statistical analysis conducted on geographies consisting of 225,267,709 people shows a substantial negative correlation between the proportion of Immigrants from Haiti and median earnings in the United States with a correlation coefficient (R) of -0.509 and weighted average of $40,550. Similarly, the statistical analysis conducted on geographies consisting of 279,892,133 people shows a poor negative correlation between the proportion of Immigrants from Iran and median earnings in the United States with a correlation coefficient (R) of -0.159 and weighted average of $57,612, a difference of 42.1%.
Median Earnings Correlation Summary
| Measurement | Immigrants from Haiti | Immigrants from Iran |
| Minimum | $21,741 | $14,861 |
| Maximum | $54,545 | $117,429 |
| Range | $32,804 | $102,568 |
| Mean | $37,122 | $67,470 |
| Median | $37,540 | $67,500 |
| Interquartile 25% (IQ1) | $30,770 | $54,982 |
| Interquartile 75% (IQ3) | $43,463 | $79,813 |
| Interquartile Range (IQR) | $12,693 | $24,831 |
| Standard Deviation (Sample) | $7,185 | $17,753 |
| Standard Deviation (Population) | $7,140 | $17,645 |
Similar Demographics by Median Earnings
Demographics Similar to Immigrants from Haiti by Median Earnings
In terms of median earnings, the demographic groups most similar to Immigrants from Haiti are Cuban ($40,619, a difference of 0.17%), Honduran ($40,638, a difference of 0.22%), Yaqui ($40,647, a difference of 0.24%), Chickasaw ($40,672, a difference of 0.30%), and Apache ($40,388, a difference of 0.40%).
| Demographics | Rating | Rank | Median Earnings |
| Shoshone | 0.0 /100 | #302 | Tragic $40,932 |
| Haitians | 0.0 /100 | #303 | Tragic $40,918 |
| Immigrants | Guatemala | 0.0 /100 | #304 | Tragic $40,851 |
| Chickasaw | 0.0 /100 | #305 | Tragic $40,672 |
| Yaqui | 0.0 /100 | #306 | Tragic $40,647 |
| Hondurans | 0.0 /100 | #307 | Tragic $40,638 |
| Cubans | 0.0 /100 | #308 | Tragic $40,619 |
| Immigrants | Haiti | 0.0 /100 | #309 | Tragic $40,550 |
| Apache | 0.0 /100 | #310 | Tragic $40,388 |
| Hispanics or Latinos | 0.0 /100 | #311 | Tragic $40,288 |
| Chippewa | 0.0 /100 | #312 | Tragic $40,287 |
| Choctaw | 0.0 /100 | #313 | Tragic $40,270 |
| Cheyenne | 0.0 /100 | #314 | Tragic $40,233 |
| Seminole | 0.0 /100 | #315 | Tragic $40,233 |
| Immigrants | Honduras | 0.0 /100 | #316 | Tragic $40,195 |
Demographics Similar to Immigrants from Iran by Median Earnings
In terms of median earnings, the demographic groups most similar to Immigrants from Iran are Okinawan ($57,550, a difference of 0.11%), Immigrants from South Central Asia ($57,114, a difference of 0.87%), Immigrants from Israel ($57,034, a difference of 1.0%), Immigrants from Ireland ($56,854, a difference of 1.3%), and Iranian ($58,474, a difference of 1.5%).
| Demographics | Rating | Rank | Median Earnings |
| Filipinos | 100.0 /100 | #1 | Exceptional $61,197 |
| Immigrants | Taiwan | 100.0 /100 | #2 | Exceptional $61,151 |
| Immigrants | India | 100.0 /100 | #3 | Exceptional $60,648 |
| Immigrants | Hong Kong | 100.0 /100 | #4 | Exceptional $59,433 |
| Thais | 100.0 /100 | #5 | Exceptional $59,237 |
| Immigrants | Singapore | 100.0 /100 | #6 | Exceptional $59,038 |
| Iranians | 100.0 /100 | #7 | Exceptional $58,474 |
| Immigrants | Iran | 100.0 /100 | #8 | Exceptional $57,612 |
| Okinawans | 100.0 /100 | #9 | Exceptional $57,550 |
| Immigrants | South Central Asia | 100.0 /100 | #10 | Exceptional $57,114 |
| Immigrants | Israel | 100.0 /100 | #11 | Exceptional $57,034 |
| Immigrants | Ireland | 100.0 /100 | #12 | Exceptional $56,854 |
| Immigrants | China | 100.0 /100 | #13 | Exceptional $56,638 |
| Immigrants | Australia | 100.0 /100 | #14 | Exceptional $56,305 |
| Indians (Asian) | 100.0 /100 | #15 | Exceptional $56,253 |