Immigrants from Uganda vs British Median Earnings
COMPARE
Immigrants from Uganda
British
Median Earnings
Median Earnings Comparison
Immigrants from Uganda
British
$48,041
MEDIAN EARNINGS
90.5/ 100
METRIC RATING
133rd/ 347
METRIC RANK
$48,189
MEDIAN EARNINGS
92.2/ 100
METRIC RATING
132nd/ 347
METRIC RANK
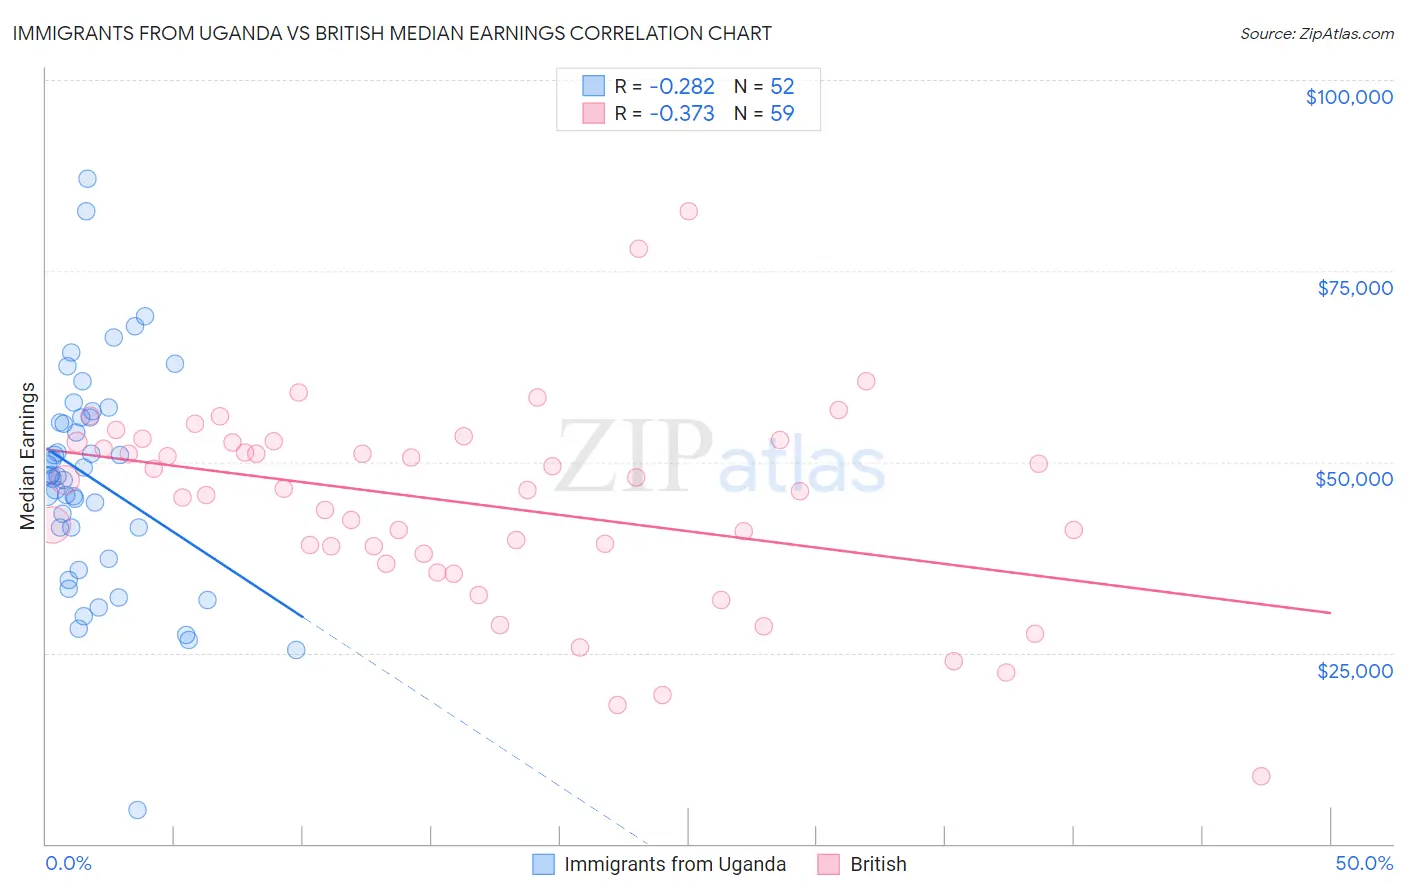
Immigrants from Uganda vs British Median Earnings Correlation Chart
The statistical analysis conducted on geographies consisting of 125,980,560 people shows a weak negative correlation between the proportion of Immigrants from Uganda and median earnings in the United States with a correlation coefficient (R) of -0.282 and weighted average of $48,041. Similarly, the statistical analysis conducted on geographies consisting of 531,344,409 people shows a mild negative correlation between the proportion of British and median earnings in the United States with a correlation coefficient (R) of -0.373 and weighted average of $48,189, a difference of 0.31%.
Median Earnings Correlation Summary
| Measurement | Immigrants from Uganda | British |
| Minimum | $4,426 | $8,915 |
| Maximum | $87,021 | $82,773 |
| Range | $82,595 | $73,858 |
| Mean | $47,722 | $44,491 |
| Median | $48,140 | $46,291 |
| Interquartile 25% (IQ1) | $39,326 | $37,889 |
| Interquartile 75% (IQ3) | $55,755 | $52,582 |
| Interquartile Range (IQR) | $16,429 | $14,693 |
| Standard Deviation (Sample) | $14,671 | $13,191 |
| Standard Deviation (Population) | $14,529 | $13,079 |
Demographics Similar to Immigrants from Uganda and British by Median Earnings
In terms of median earnings, the demographic groups most similar to Immigrants from Uganda are Sri Lankan ($48,040, a difference of 0.0%), Portuguese ($48,032, a difference of 0.020%), Slovene ($47,995, a difference of 0.10%), Immigrants from Nepal ($47,925, a difference of 0.24%), and European ($47,915, a difference of 0.26%). Similarly, the demographic groups most similar to British are Zimbabwean ($48,229, a difference of 0.080%), Lebanese ($48,226, a difference of 0.080%), Pakistani ($48,254, a difference of 0.14%), Immigrants from Philippines ($48,266, a difference of 0.16%), and Sierra Leonean ($48,286, a difference of 0.20%).
| Demographics | Rating | Rank | Median Earnings |
| Chileans | 94.8 /100 | #122 | Exceptional $48,504 |
| Immigrants | Syria | 93.9 /100 | #123 | Exceptional $48,375 |
| Brazilians | 93.7 /100 | #124 | Exceptional $48,356 |
| Immigrants | Fiji | 93.3 /100 | #125 | Exceptional $48,305 |
| Assyrians/Chaldeans/Syriacs | 93.3 /100 | #126 | Exceptional $48,304 |
| Sierra Leoneans | 93.1 /100 | #127 | Exceptional $48,286 |
| Immigrants | Philippines | 92.9 /100 | #128 | Exceptional $48,266 |
| Pakistanis | 92.8 /100 | #129 | Exceptional $48,254 |
| Zimbabweans | 92.6 /100 | #130 | Exceptional $48,229 |
| Lebanese | 92.5 /100 | #131 | Exceptional $48,226 |
| British | 92.2 /100 | #132 | Exceptional $48,189 |
| Immigrants | Uganda | 90.5 /100 | #133 | Exceptional $48,041 |
| Sri Lankans | 90.5 /100 | #134 | Exceptional $48,040 |
| Portuguese | 90.4 /100 | #135 | Exceptional $48,032 |
| Slovenes | 90.0 /100 | #136 | Excellent $47,995 |
| Immigrants | Nepal | 89.0 /100 | #137 | Excellent $47,925 |
| Europeans | 88.9 /100 | #138 | Excellent $47,915 |
| Canadians | 88.8 /100 | #139 | Excellent $47,911 |
| Taiwanese | 88.7 /100 | #140 | Excellent $47,902 |
| Immigrants | Sierra Leone | 88.3 /100 | #141 | Excellent $47,875 |
| Ugandans | 88.0 /100 | #142 | Excellent $47,854 |