Immigrants from Uganda vs Samoan Median Earnings
COMPARE
Immigrants from Uganda
Samoan
Median Earnings
Median Earnings Comparison
Immigrants from Uganda
Samoans
$48,041
MEDIAN EARNINGS
90.5/ 100
METRIC RATING
133rd/ 347
METRIC RANK
$44,206
MEDIAN EARNINGS
4.2/ 100
METRIC RATING
241st/ 347
METRIC RANK
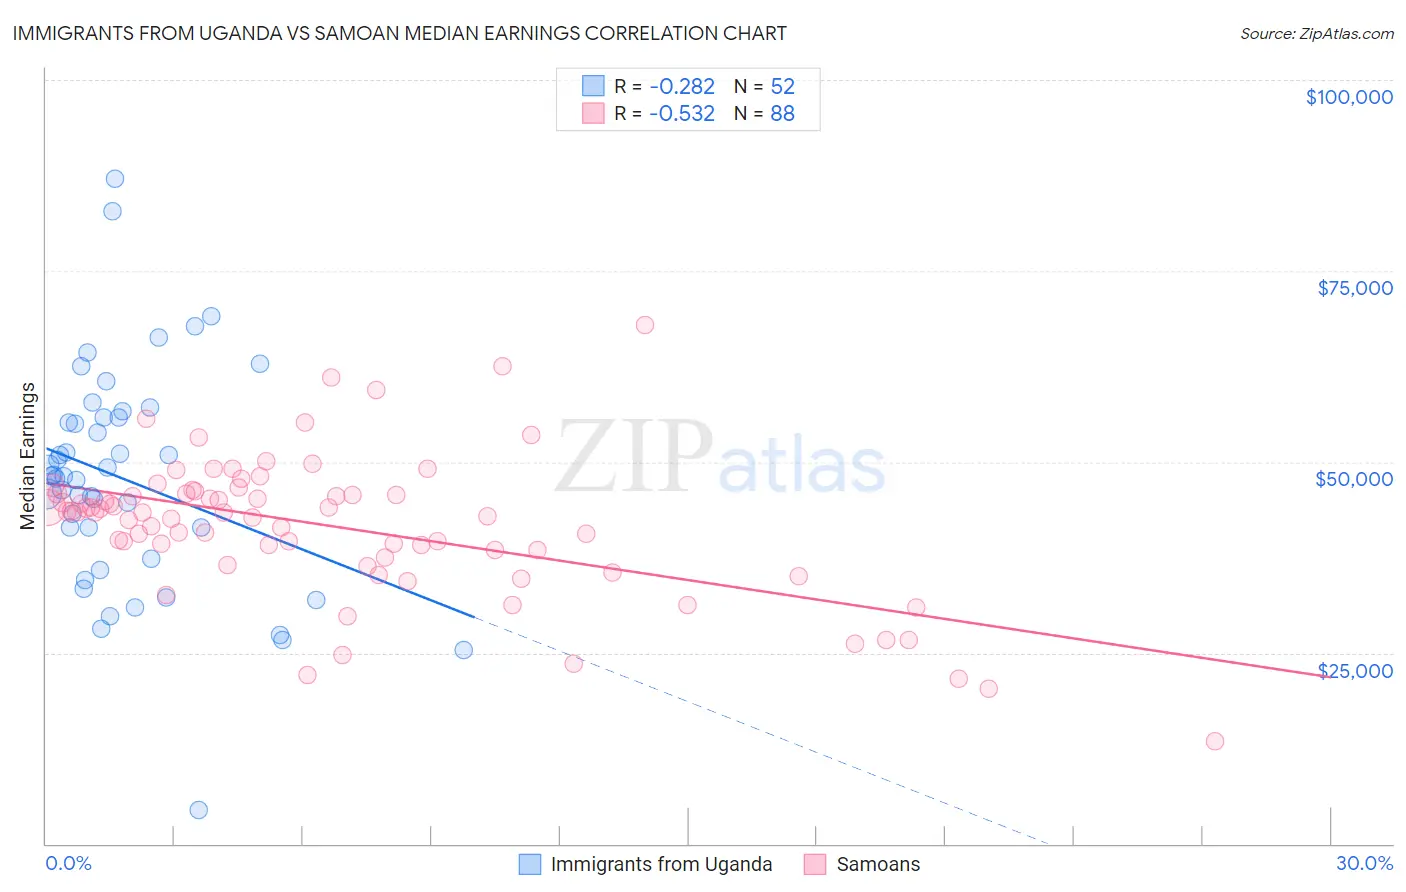
Immigrants from Uganda vs Samoan Median Earnings Correlation Chart
The statistical analysis conducted on geographies consisting of 125,980,560 people shows a weak negative correlation between the proportion of Immigrants from Uganda and median earnings in the United States with a correlation coefficient (R) of -0.282 and weighted average of $48,041. Similarly, the statistical analysis conducted on geographies consisting of 225,197,093 people shows a substantial negative correlation between the proportion of Samoans and median earnings in the United States with a correlation coefficient (R) of -0.532 and weighted average of $44,206, a difference of 8.7%.
Median Earnings Correlation Summary
| Measurement | Immigrants from Uganda | Samoan |
| Minimum | $4,426 | $13,413 |
| Maximum | $87,021 | $67,875 |
| Range | $82,595 | $54,462 |
| Mean | $47,722 | $41,589 |
| Median | $48,140 | $43,332 |
| Interquartile 25% (IQ1) | $39,326 | $37,950 |
| Interquartile 75% (IQ3) | $55,755 | $45,824 |
| Interquartile Range (IQR) | $16,429 | $7,874 |
| Standard Deviation (Sample) | $14,671 | $9,289 |
| Standard Deviation (Population) | $14,529 | $9,236 |
Similar Demographics by Median Earnings
Demographics Similar to Immigrants from Uganda by Median Earnings
In terms of median earnings, the demographic groups most similar to Immigrants from Uganda are Sri Lankan ($48,040, a difference of 0.0%), Portuguese ($48,032, a difference of 0.020%), Slovene ($47,995, a difference of 0.10%), Immigrants from Nepal ($47,925, a difference of 0.24%), and European ($47,915, a difference of 0.26%).
| Demographics | Rating | Rank | Median Earnings |
| Assyrians/Chaldeans/Syriacs | 93.3 /100 | #126 | Exceptional $48,304 |
| Sierra Leoneans | 93.1 /100 | #127 | Exceptional $48,286 |
| Immigrants | Philippines | 92.9 /100 | #128 | Exceptional $48,266 |
| Pakistanis | 92.8 /100 | #129 | Exceptional $48,254 |
| Zimbabweans | 92.6 /100 | #130 | Exceptional $48,229 |
| Lebanese | 92.5 /100 | #131 | Exceptional $48,226 |
| British | 92.2 /100 | #132 | Exceptional $48,189 |
| Immigrants | Uganda | 90.5 /100 | #133 | Exceptional $48,041 |
| Sri Lankans | 90.5 /100 | #134 | Exceptional $48,040 |
| Portuguese | 90.4 /100 | #135 | Exceptional $48,032 |
| Slovenes | 90.0 /100 | #136 | Excellent $47,995 |
| Immigrants | Nepal | 89.0 /100 | #137 | Excellent $47,925 |
| Europeans | 88.9 /100 | #138 | Excellent $47,915 |
| Canadians | 88.8 /100 | #139 | Excellent $47,911 |
| Taiwanese | 88.7 /100 | #140 | Excellent $47,902 |
Demographics Similar to Samoans by Median Earnings
In terms of median earnings, the demographic groups most similar to Samoans are Aleut ($44,241, a difference of 0.080%), Immigrants from Venezuela ($44,163, a difference of 0.10%), Subsaharan African ($44,118, a difference of 0.20%), Nonimmigrants ($44,117, a difference of 0.20%), and Senegalese ($44,373, a difference of 0.38%).
| Demographics | Rating | Rank | Median Earnings |
| Cape Verdeans | 7.5 /100 | #234 | Tragic $44,640 |
| Venezuelans | 6.9 /100 | #235 | Tragic $44,580 |
| British West Indians | 6.7 /100 | #236 | Tragic $44,552 |
| Immigrants | Ecuador | 5.9 /100 | #237 | Tragic $44,462 |
| Sudanese | 5.6 /100 | #238 | Tragic $44,419 |
| Senegalese | 5.3 /100 | #239 | Tragic $44,373 |
| Aleuts | 4.4 /100 | #240 | Tragic $44,241 |
| Samoans | 4.2 /100 | #241 | Tragic $44,206 |
| Immigrants | Venezuela | 4.0 /100 | #242 | Tragic $44,163 |
| Sub-Saharan Africans | 3.7 /100 | #243 | Tragic $44,118 |
| Immigrants | Nonimmigrants | 3.7 /100 | #244 | Tragic $44,117 |
| Immigrants | Burma/Myanmar | 3.2 /100 | #245 | Tragic $43,998 |
| Immigrants | West Indies | 3.1 /100 | #246 | Tragic $43,989 |
| Immigrants | Cabo Verde | 3.0 /100 | #247 | Tragic $43,963 |
| Nepalese | 2.6 /100 | #248 | Tragic $43,860 |