Immigrants from Belize vs Immigrants from Iran Median Earnings
COMPARE
Immigrants from Belize
Immigrants from Iran
Median Earnings
Median Earnings Comparison
Immigrants from Belize
Immigrants from Iran
$42,339
MEDIAN EARNINGS
0.3/ 100
METRIC RATING
275th/ 347
METRIC RANK
$57,612
MEDIAN EARNINGS
100.0/ 100
METRIC RATING
8th/ 347
METRIC RANK
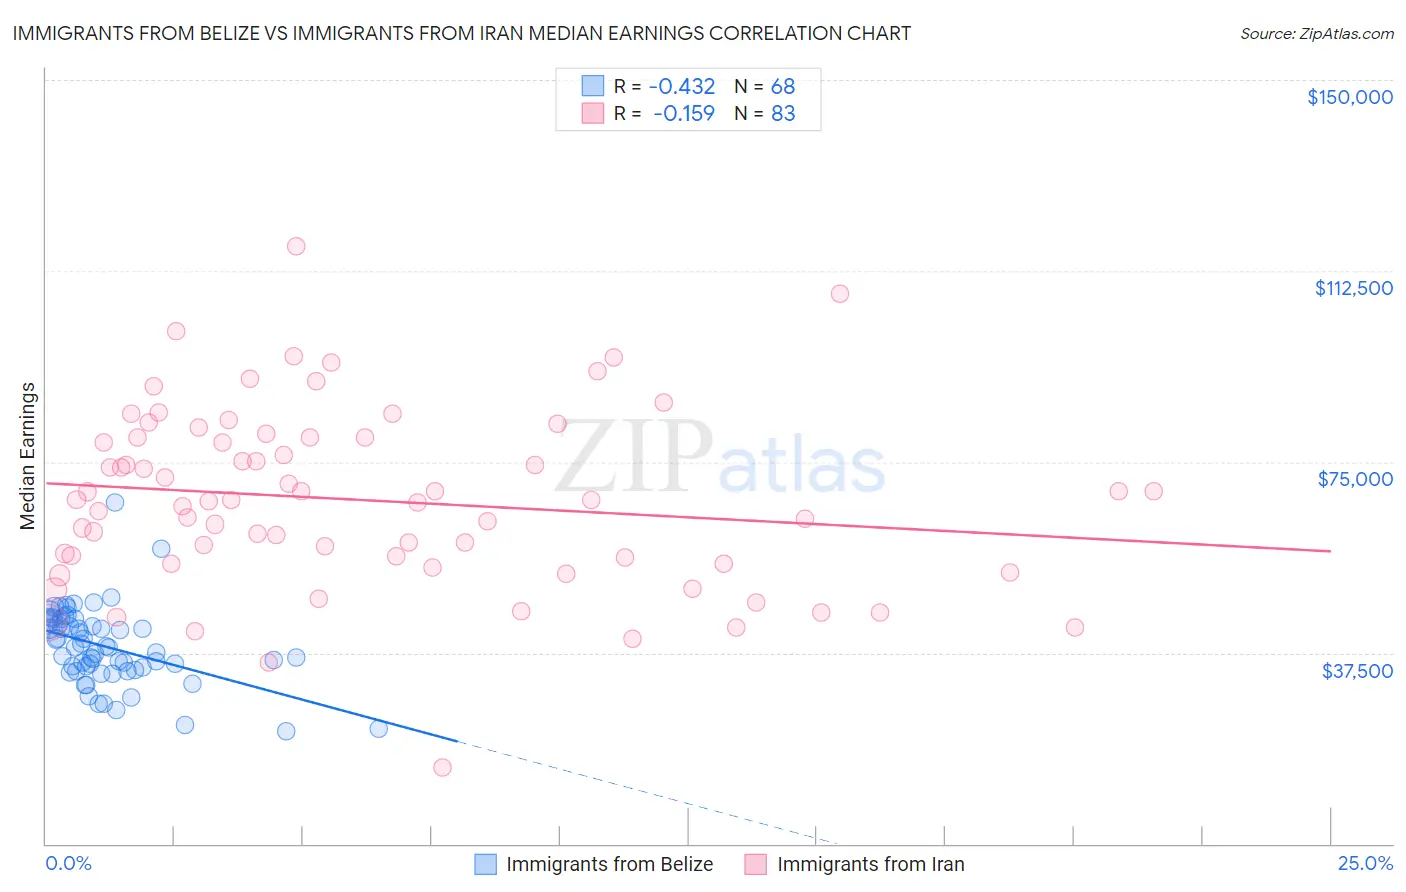
Immigrants from Belize vs Immigrants from Iran Median Earnings Correlation Chart
The statistical analysis conducted on geographies consisting of 130,311,555 people shows a moderate negative correlation between the proportion of Immigrants from Belize and median earnings in the United States with a correlation coefficient (R) of -0.432 and weighted average of $42,339. Similarly, the statistical analysis conducted on geographies consisting of 279,892,133 people shows a poor negative correlation between the proportion of Immigrants from Iran and median earnings in the United States with a correlation coefficient (R) of -0.159 and weighted average of $57,612, a difference of 36.1%.
Median Earnings Correlation Summary
| Measurement | Immigrants from Belize | Immigrants from Iran |
| Minimum | $22,042 | $14,861 |
| Maximum | $66,975 | $117,429 |
| Range | $44,933 | $102,568 |
| Mean | $38,697 | $67,470 |
| Median | $38,598 | $67,500 |
| Interquartile 25% (IQ1) | $34,404 | $54,982 |
| Interquartile 75% (IQ3) | $43,711 | $79,813 |
| Interquartile Range (IQR) | $9,306 | $24,831 |
| Standard Deviation (Sample) | $7,646 | $17,753 |
| Standard Deviation (Population) | $7,590 | $17,645 |
Similar Demographics by Median Earnings
Demographics Similar to Immigrants from Belize by Median Earnings
In terms of median earnings, the demographic groups most similar to Immigrants from Belize are Spanish American ($42,316, a difference of 0.060%), Central American ($42,280, a difference of 0.14%), Immigrants from El Salvador ($42,413, a difference of 0.18%), Immigrants from Dominica ($42,420, a difference of 0.19%), and Iroquois ($42,430, a difference of 0.22%).
| Demographics | Rating | Rank | Median Earnings |
| Americans | 0.6 /100 | #268 | Tragic $42,742 |
| Belizeans | 0.5 /100 | #269 | Tragic $42,702 |
| Osage | 0.5 /100 | #270 | Tragic $42,651 |
| Pennsylvania Germans | 0.5 /100 | #271 | Tragic $42,615 |
| Iroquois | 0.4 /100 | #272 | Tragic $42,430 |
| Immigrants | Dominica | 0.4 /100 | #273 | Tragic $42,420 |
| Immigrants | El Salvador | 0.4 /100 | #274 | Tragic $42,413 |
| Immigrants | Belize | 0.3 /100 | #275 | Tragic $42,339 |
| Spanish Americans | 0.3 /100 | #276 | Tragic $42,316 |
| Central Americans | 0.3 /100 | #277 | Tragic $42,280 |
| Cajuns | 0.3 /100 | #278 | Tragic $42,189 |
| Colville | 0.2 /100 | #279 | Tragic $42,151 |
| Hmong | 0.2 /100 | #280 | Tragic $42,111 |
| Marshallese | 0.2 /100 | #281 | Tragic $41,969 |
| Africans | 0.2 /100 | #282 | Tragic $41,955 |
Demographics Similar to Immigrants from Iran by Median Earnings
In terms of median earnings, the demographic groups most similar to Immigrants from Iran are Okinawan ($57,550, a difference of 0.11%), Immigrants from South Central Asia ($57,114, a difference of 0.87%), Immigrants from Israel ($57,034, a difference of 1.0%), Immigrants from Ireland ($56,854, a difference of 1.3%), and Iranian ($58,474, a difference of 1.5%).
| Demographics | Rating | Rank | Median Earnings |
| Filipinos | 100.0 /100 | #1 | Exceptional $61,197 |
| Immigrants | Taiwan | 100.0 /100 | #2 | Exceptional $61,151 |
| Immigrants | India | 100.0 /100 | #3 | Exceptional $60,648 |
| Immigrants | Hong Kong | 100.0 /100 | #4 | Exceptional $59,433 |
| Thais | 100.0 /100 | #5 | Exceptional $59,237 |
| Immigrants | Singapore | 100.0 /100 | #6 | Exceptional $59,038 |
| Iranians | 100.0 /100 | #7 | Exceptional $58,474 |
| Immigrants | Iran | 100.0 /100 | #8 | Exceptional $57,612 |
| Okinawans | 100.0 /100 | #9 | Exceptional $57,550 |
| Immigrants | South Central Asia | 100.0 /100 | #10 | Exceptional $57,114 |
| Immigrants | Israel | 100.0 /100 | #11 | Exceptional $57,034 |
| Immigrants | Ireland | 100.0 /100 | #12 | Exceptional $56,854 |
| Immigrants | China | 100.0 /100 | #13 | Exceptional $56,638 |
| Immigrants | Australia | 100.0 /100 | #14 | Exceptional $56,305 |
| Indians (Asian) | 100.0 /100 | #15 | Exceptional $56,253 |