Navajo vs Immigrants from Iran Median Earnings
COMPARE
Navajo
Immigrants from Iran
Median Earnings
Median Earnings Comparison
Navajo
Immigrants from Iran
$36,999
MEDIAN EARNINGS
0.0/ 100
METRIC RATING
340th/ 347
METRIC RANK
$57,612
MEDIAN EARNINGS
100.0/ 100
METRIC RATING
8th/ 347
METRIC RANK
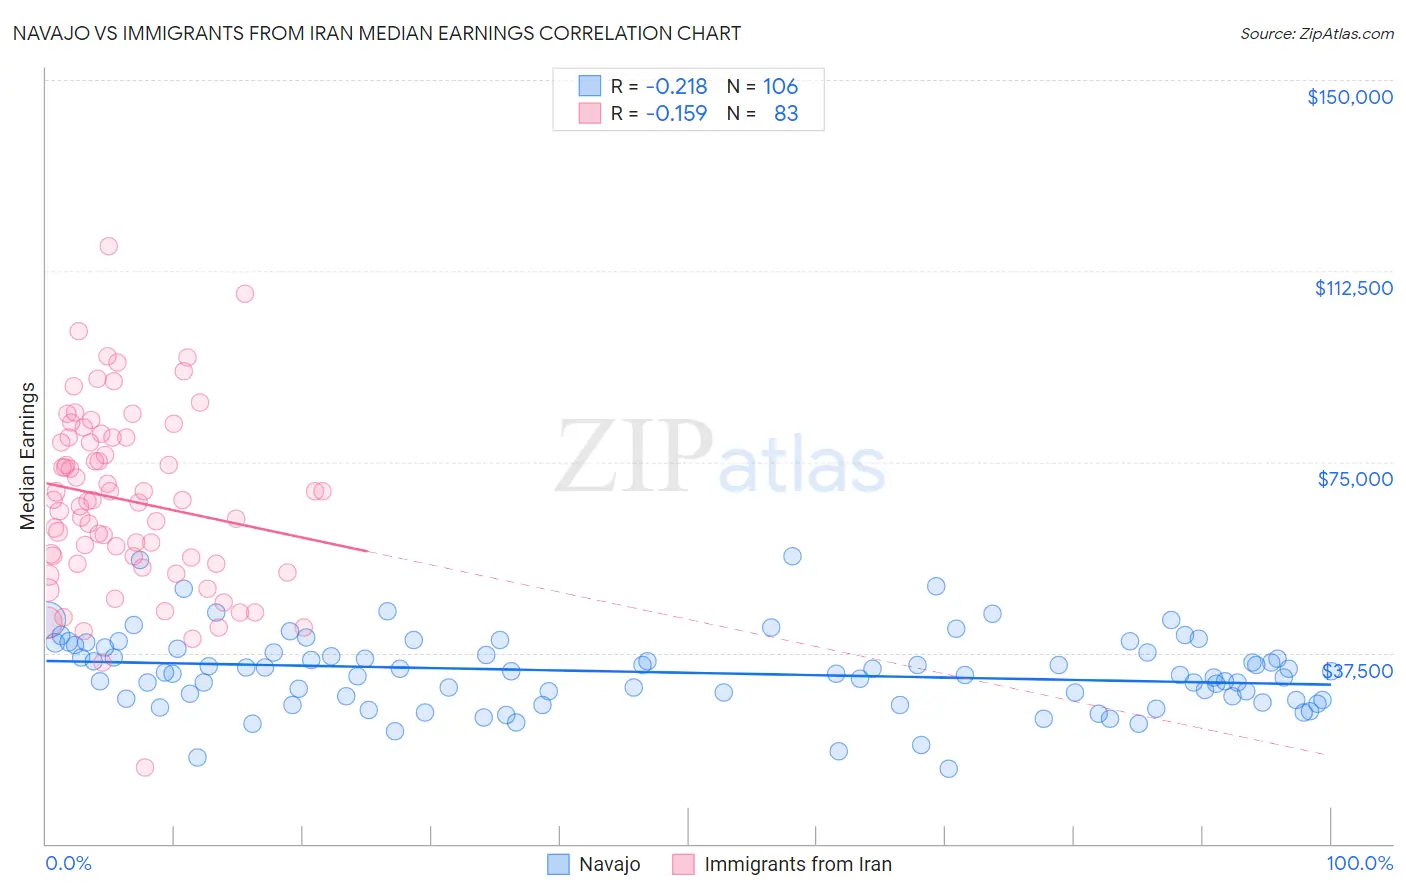
Navajo vs Immigrants from Iran Median Earnings Correlation Chart
The statistical analysis conducted on geographies consisting of 224,830,448 people shows a weak negative correlation between the proportion of Navajo and median earnings in the United States with a correlation coefficient (R) of -0.218 and weighted average of $36,999. Similarly, the statistical analysis conducted on geographies consisting of 279,892,133 people shows a poor negative correlation between the proportion of Immigrants from Iran and median earnings in the United States with a correlation coefficient (R) of -0.159 and weighted average of $57,612, a difference of 55.7%.
Median Earnings Correlation Summary
| Measurement | Navajo | Immigrants from Iran |
| Minimum | $14,775 | $14,861 |
| Maximum | $56,536 | $117,429 |
| Range | $41,761 | $102,568 |
| Mean | $33,645 | $67,470 |
| Median | $33,604 | $67,500 |
| Interquartile 25% (IQ1) | $28,471 | $54,982 |
| Interquartile 75% (IQ3) | $38,362 | $79,813 |
| Interquartile Range (IQR) | $9,890 | $24,831 |
| Standard Deviation (Sample) | $7,461 | $17,753 |
| Standard Deviation (Population) | $7,426 | $17,645 |
Similar Demographics by Median Earnings
Demographics Similar to Navajo by Median Earnings
In terms of median earnings, the demographic groups most similar to Navajo are Lumbee ($36,876, a difference of 0.33%), Hopi ($36,871, a difference of 0.35%), Pueblo ($36,859, a difference of 0.38%), Arapaho ($36,586, a difference of 1.1%), and Tohono O'odham ($36,349, a difference of 1.8%).
| Demographics | Rating | Rank | Median Earnings |
| Houma | 0.0 /100 | #333 | Tragic $38,949 |
| Spanish American Indians | 0.0 /100 | #334 | Tragic $38,907 |
| Natives/Alaskans | 0.0 /100 | #335 | Tragic $38,896 |
| Crow | 0.0 /100 | #336 | Tragic $38,707 |
| Immigrants | Cuba | 0.0 /100 | #337 | Tragic $38,426 |
| Pima | 0.0 /100 | #338 | Tragic $38,285 |
| Menominee | 0.0 /100 | #339 | Tragic $37,884 |
| Navajo | 0.0 /100 | #340 | Tragic $36,999 |
| Lumbee | 0.0 /100 | #341 | Tragic $36,876 |
| Hopi | 0.0 /100 | #342 | Tragic $36,871 |
| Pueblo | 0.0 /100 | #343 | Tragic $36,859 |
| Arapaho | 0.0 /100 | #344 | Tragic $36,586 |
| Tohono O'odham | 0.0 /100 | #345 | Tragic $36,349 |
| Yup'ik | 0.0 /100 | #346 | Tragic $35,942 |
| Puerto Ricans | 0.0 /100 | #347 | Tragic $35,560 |
Demographics Similar to Immigrants from Iran by Median Earnings
In terms of median earnings, the demographic groups most similar to Immigrants from Iran are Okinawan ($57,550, a difference of 0.11%), Immigrants from South Central Asia ($57,114, a difference of 0.87%), Immigrants from Israel ($57,034, a difference of 1.0%), Immigrants from Ireland ($56,854, a difference of 1.3%), and Iranian ($58,474, a difference of 1.5%).
| Demographics | Rating | Rank | Median Earnings |
| Filipinos | 100.0 /100 | #1 | Exceptional $61,197 |
| Immigrants | Taiwan | 100.0 /100 | #2 | Exceptional $61,151 |
| Immigrants | India | 100.0 /100 | #3 | Exceptional $60,648 |
| Immigrants | Hong Kong | 100.0 /100 | #4 | Exceptional $59,433 |
| Thais | 100.0 /100 | #5 | Exceptional $59,237 |
| Immigrants | Singapore | 100.0 /100 | #6 | Exceptional $59,038 |
| Iranians | 100.0 /100 | #7 | Exceptional $58,474 |
| Immigrants | Iran | 100.0 /100 | #8 | Exceptional $57,612 |
| Okinawans | 100.0 /100 | #9 | Exceptional $57,550 |
| Immigrants | South Central Asia | 100.0 /100 | #10 | Exceptional $57,114 |
| Immigrants | Israel | 100.0 /100 | #11 | Exceptional $57,034 |
| Immigrants | Ireland | 100.0 /100 | #12 | Exceptional $56,854 |
| Immigrants | China | 100.0 /100 | #13 | Exceptional $56,638 |
| Immigrants | Australia | 100.0 /100 | #14 | Exceptional $56,305 |
| Indians (Asian) | 100.0 /100 | #15 | Exceptional $56,253 |