Immigrants from Uganda vs Icelander Median Earnings
COMPARE
Immigrants from Uganda
Icelander
Median Earnings
Median Earnings Comparison
Immigrants from Uganda
Icelanders
$48,041
MEDIAN EARNINGS
90.5/ 100
METRIC RATING
133rd/ 347
METRIC RANK
$46,916
MEDIAN EARNINGS
66.3/ 100
METRIC RATING
163rd/ 347
METRIC RANK
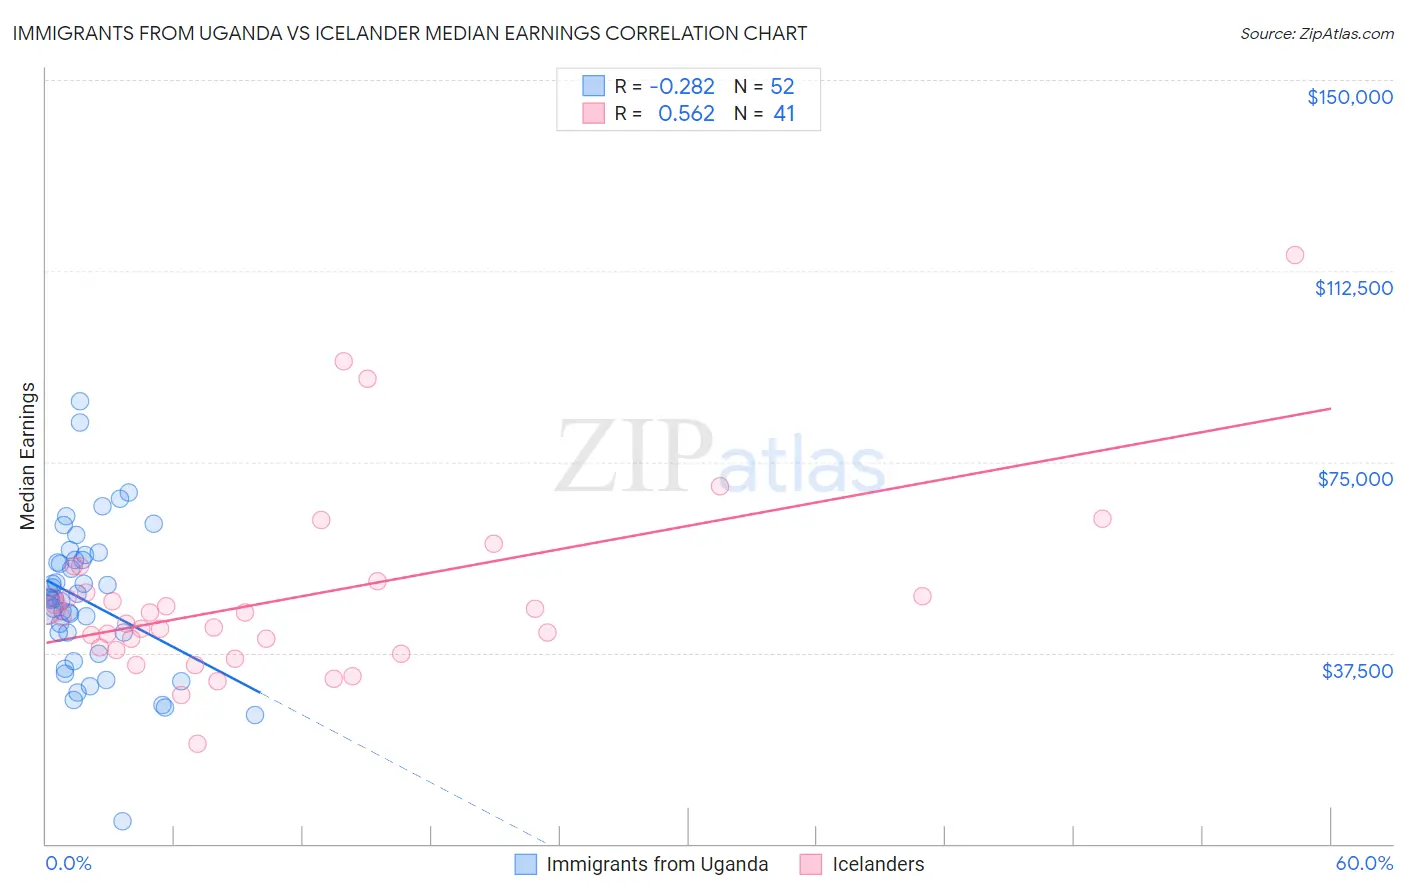
Immigrants from Uganda vs Icelander Median Earnings Correlation Chart
The statistical analysis conducted on geographies consisting of 125,980,560 people shows a weak negative correlation between the proportion of Immigrants from Uganda and median earnings in the United States with a correlation coefficient (R) of -0.282 and weighted average of $48,041. Similarly, the statistical analysis conducted on geographies consisting of 159,666,599 people shows a substantial positive correlation between the proportion of Icelanders and median earnings in the United States with a correlation coefficient (R) of 0.562 and weighted average of $46,916, a difference of 2.4%.
Median Earnings Correlation Summary
| Measurement | Immigrants from Uganda | Icelander |
| Minimum | $4,426 | $19,583 |
| Maximum | $87,021 | $115,625 |
| Range | $82,595 | $96,042 |
| Mean | $47,722 | $48,186 |
| Median | $48,140 | $44,536 |
| Interquartile 25% (IQ1) | $39,326 | $38,407 |
| Interquartile 75% (IQ3) | $55,755 | $50,498 |
| Interquartile Range (IQR) | $16,429 | $12,091 |
| Standard Deviation (Sample) | $14,671 | $17,953 |
| Standard Deviation (Population) | $14,529 | $17,732 |
Similar Demographics by Median Earnings
Demographics Similar to Immigrants from Uganda by Median Earnings
In terms of median earnings, the demographic groups most similar to Immigrants from Uganda are Sri Lankan ($48,040, a difference of 0.0%), Portuguese ($48,032, a difference of 0.020%), Slovene ($47,995, a difference of 0.10%), Immigrants from Nepal ($47,925, a difference of 0.24%), and European ($47,915, a difference of 0.26%).
| Demographics | Rating | Rank | Median Earnings |
| Assyrians/Chaldeans/Syriacs | 93.3 /100 | #126 | Exceptional $48,304 |
| Sierra Leoneans | 93.1 /100 | #127 | Exceptional $48,286 |
| Immigrants | Philippines | 92.9 /100 | #128 | Exceptional $48,266 |
| Pakistanis | 92.8 /100 | #129 | Exceptional $48,254 |
| Zimbabweans | 92.6 /100 | #130 | Exceptional $48,229 |
| Lebanese | 92.5 /100 | #131 | Exceptional $48,226 |
| British | 92.2 /100 | #132 | Exceptional $48,189 |
| Immigrants | Uganda | 90.5 /100 | #133 | Exceptional $48,041 |
| Sri Lankans | 90.5 /100 | #134 | Exceptional $48,040 |
| Portuguese | 90.4 /100 | #135 | Exceptional $48,032 |
| Slovenes | 90.0 /100 | #136 | Excellent $47,995 |
| Immigrants | Nepal | 89.0 /100 | #137 | Excellent $47,925 |
| Europeans | 88.9 /100 | #138 | Excellent $47,915 |
| Canadians | 88.8 /100 | #139 | Excellent $47,911 |
| Taiwanese | 88.7 /100 | #140 | Excellent $47,902 |
Demographics Similar to Icelanders by Median Earnings
In terms of median earnings, the demographic groups most similar to Icelanders are South American Indian ($46,952, a difference of 0.080%), Immigrants from Eastern Africa ($46,969, a difference of 0.11%), Norwegian ($46,865, a difference of 0.11%), Immigrants from Peru ($47,025, a difference of 0.23%), and Alsatian ($47,023, a difference of 0.23%).
| Demographics | Rating | Rank | Median Earnings |
| Irish | 76.6 /100 | #156 | Good $47,276 |
| Czechs | 75.1 /100 | #157 | Good $47,221 |
| Slovaks | 71.7 /100 | #158 | Good $47,095 |
| Immigrants | Peru | 69.6 /100 | #159 | Good $47,025 |
| Alsatians | 69.6 /100 | #160 | Good $47,023 |
| Immigrants | Eastern Africa | 68.0 /100 | #161 | Good $46,969 |
| South American Indians | 67.4 /100 | #162 | Good $46,952 |
| Icelanders | 66.3 /100 | #163 | Good $46,916 |
| Norwegians | 64.7 /100 | #164 | Good $46,865 |
| South Americans | 62.7 /100 | #165 | Good $46,804 |
| Czechoslovakians | 57.8 /100 | #166 | Average $46,658 |
| Costa Ricans | 57.4 /100 | #167 | Average $46,645 |
| Immigrants | Africa | 54.6 /100 | #168 | Average $46,564 |
| Immigrants | South America | 54.0 /100 | #169 | Average $46,548 |
| Immigrants | Immigrants | 51.6 /100 | #170 | Average $46,478 |