Immigrants from Uganda vs Filipino Median Earnings
COMPARE
Immigrants from Uganda
Filipino
Median Earnings
Median Earnings Comparison
Immigrants from Uganda
Filipinos
$48,041
MEDIAN EARNINGS
90.5/ 100
METRIC RATING
133rd/ 347
METRIC RANK
$61,197
MEDIAN EARNINGS
100.0/ 100
METRIC RATING
1st/ 347
METRIC RANK
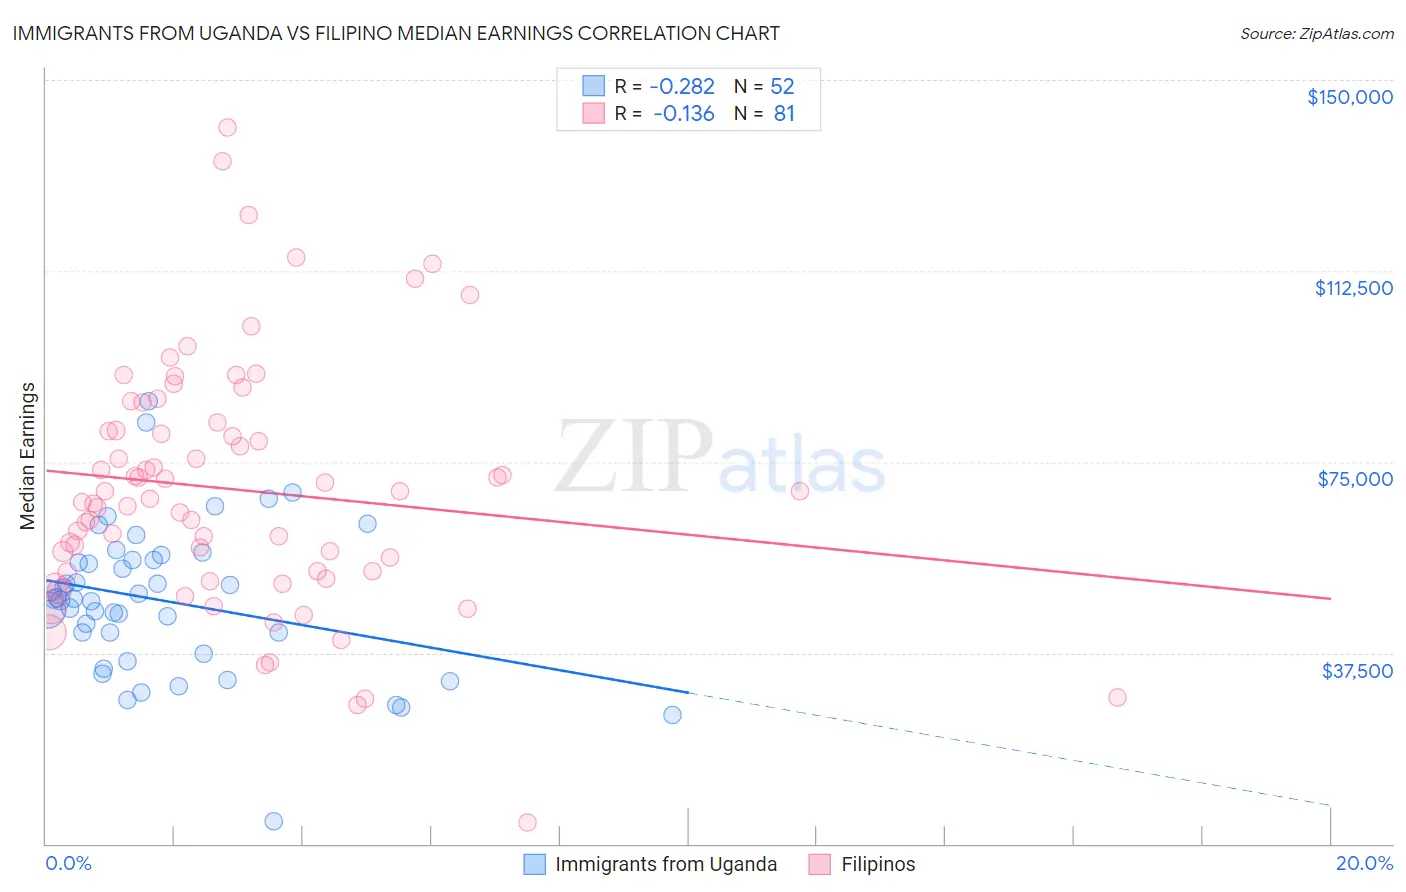
Immigrants from Uganda vs Filipino Median Earnings Correlation Chart
The statistical analysis conducted on geographies consisting of 125,980,560 people shows a weak negative correlation between the proportion of Immigrants from Uganda and median earnings in the United States with a correlation coefficient (R) of -0.282 and weighted average of $48,041. Similarly, the statistical analysis conducted on geographies consisting of 254,346,955 people shows a poor negative correlation between the proportion of Filipinos and median earnings in the United States with a correlation coefficient (R) of -0.136 and weighted average of $61,197, a difference of 27.4%.
Median Earnings Correlation Summary
| Measurement | Immigrants from Uganda | Filipino |
| Minimum | $4,426 | $4,235 |
| Maximum | $87,021 | $140,756 |
| Range | $82,595 | $136,521 |
| Mean | $47,722 | $69,566 |
| Median | $48,140 | $67,852 |
| Interquartile 25% (IQ1) | $39,326 | $53,487 |
| Interquartile 75% (IQ3) | $55,755 | $81,976 |
| Interquartile Range (IQR) | $16,429 | $28,490 |
| Standard Deviation (Sample) | $14,671 | $24,296 |
| Standard Deviation (Population) | $14,529 | $24,146 |
Similar Demographics by Median Earnings
Demographics Similar to Immigrants from Uganda by Median Earnings
In terms of median earnings, the demographic groups most similar to Immigrants from Uganda are Sri Lankan ($48,040, a difference of 0.0%), Portuguese ($48,032, a difference of 0.020%), Slovene ($47,995, a difference of 0.10%), Immigrants from Nepal ($47,925, a difference of 0.24%), and European ($47,915, a difference of 0.26%).
| Demographics | Rating | Rank | Median Earnings |
| Assyrians/Chaldeans/Syriacs | 93.3 /100 | #126 | Exceptional $48,304 |
| Sierra Leoneans | 93.1 /100 | #127 | Exceptional $48,286 |
| Immigrants | Philippines | 92.9 /100 | #128 | Exceptional $48,266 |
| Pakistanis | 92.8 /100 | #129 | Exceptional $48,254 |
| Zimbabweans | 92.6 /100 | #130 | Exceptional $48,229 |
| Lebanese | 92.5 /100 | #131 | Exceptional $48,226 |
| British | 92.2 /100 | #132 | Exceptional $48,189 |
| Immigrants | Uganda | 90.5 /100 | #133 | Exceptional $48,041 |
| Sri Lankans | 90.5 /100 | #134 | Exceptional $48,040 |
| Portuguese | 90.4 /100 | #135 | Exceptional $48,032 |
| Slovenes | 90.0 /100 | #136 | Excellent $47,995 |
| Immigrants | Nepal | 89.0 /100 | #137 | Excellent $47,925 |
| Europeans | 88.9 /100 | #138 | Excellent $47,915 |
| Canadians | 88.8 /100 | #139 | Excellent $47,911 |
| Taiwanese | 88.7 /100 | #140 | Excellent $47,902 |
Demographics Similar to Filipinos by Median Earnings
In terms of median earnings, the demographic groups most similar to Filipinos are Immigrants from Taiwan ($61,151, a difference of 0.080%), Immigrants from India ($60,648, a difference of 0.91%), Immigrants from Hong Kong ($59,433, a difference of 3.0%), Thai ($59,237, a difference of 3.3%), and Immigrants from Singapore ($59,038, a difference of 3.7%).
| Demographics | Rating | Rank | Median Earnings |
| Filipinos | 100.0 /100 | #1 | Exceptional $61,197 |
| Immigrants | Taiwan | 100.0 /100 | #2 | Exceptional $61,151 |
| Immigrants | India | 100.0 /100 | #3 | Exceptional $60,648 |
| Immigrants | Hong Kong | 100.0 /100 | #4 | Exceptional $59,433 |
| Thais | 100.0 /100 | #5 | Exceptional $59,237 |
| Immigrants | Singapore | 100.0 /100 | #6 | Exceptional $59,038 |
| Iranians | 100.0 /100 | #7 | Exceptional $58,474 |
| Immigrants | Iran | 100.0 /100 | #8 | Exceptional $57,612 |
| Okinawans | 100.0 /100 | #9 | Exceptional $57,550 |
| Immigrants | South Central Asia | 100.0 /100 | #10 | Exceptional $57,114 |
| Immigrants | Israel | 100.0 /100 | #11 | Exceptional $57,034 |
| Immigrants | Ireland | 100.0 /100 | #12 | Exceptional $56,854 |
| Immigrants | China | 100.0 /100 | #13 | Exceptional $56,638 |
| Immigrants | Australia | 100.0 /100 | #14 | Exceptional $56,305 |
| Indians (Asian) | 100.0 /100 | #15 | Exceptional $56,253 |