Belizean vs Immigrants from Iran Median Earnings
COMPARE
Belizean
Immigrants from Iran
Median Earnings
Median Earnings Comparison
Belizeans
Immigrants from Iran
$42,702
MEDIAN EARNINGS
0.5/ 100
METRIC RATING
269th/ 347
METRIC RANK
$57,612
MEDIAN EARNINGS
100.0/ 100
METRIC RATING
8th/ 347
METRIC RANK
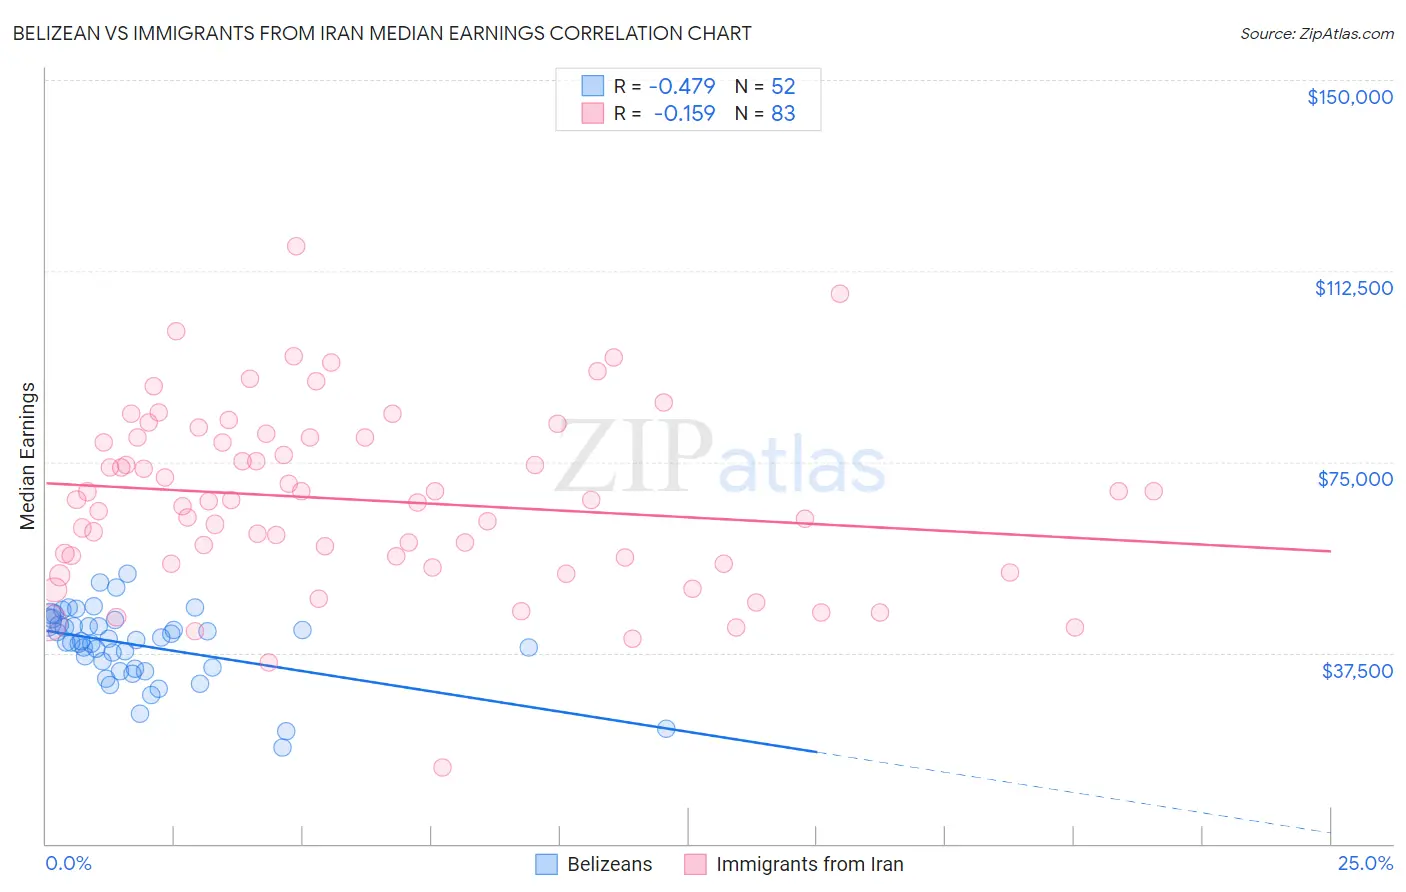
Belizean vs Immigrants from Iran Median Earnings Correlation Chart
The statistical analysis conducted on geographies consisting of 144,215,704 people shows a moderate negative correlation between the proportion of Belizeans and median earnings in the United States with a correlation coefficient (R) of -0.479 and weighted average of $42,702. Similarly, the statistical analysis conducted on geographies consisting of 279,892,133 people shows a poor negative correlation between the proportion of Immigrants from Iran and median earnings in the United States with a correlation coefficient (R) of -0.159 and weighted average of $57,612, a difference of 34.9%.
Median Earnings Correlation Summary
| Measurement | Belizean | Immigrants from Iran |
| Minimum | $18,932 | $14,861 |
| Maximum | $52,967 | $117,429 |
| Range | $34,035 | $102,568 |
| Mean | $38,949 | $67,470 |
| Median | $39,910 | $67,500 |
| Interquartile 25% (IQ1) | $34,513 | $54,982 |
| Interquartile 75% (IQ3) | $43,245 | $79,813 |
| Interquartile Range (IQR) | $8,732 | $24,831 |
| Standard Deviation (Sample) | $7,165 | $17,753 |
| Standard Deviation (Population) | $7,096 | $17,645 |
Similar Demographics by Median Earnings
Demographics Similar to Belizeans by Median Earnings
In terms of median earnings, the demographic groups most similar to Belizeans are American ($42,742, a difference of 0.090%), Osage ($42,651, a difference of 0.12%), Cree ($42,777, a difference of 0.17%), Pennsylvania German ($42,615, a difference of 0.21%), and Immigrants from Laos ($42,884, a difference of 0.43%).
| Demographics | Rating | Rank | Median Earnings |
| Nicaraguans | 0.8 /100 | #262 | Tragic $43,026 |
| Inupiat | 0.8 /100 | #263 | Tragic $43,000 |
| Immigrants | Liberia | 0.7 /100 | #264 | Tragic $42,923 |
| Salvadorans | 0.7 /100 | #265 | Tragic $42,912 |
| Immigrants | Laos | 0.7 /100 | #266 | Tragic $42,884 |
| Cree | 0.6 /100 | #267 | Tragic $42,777 |
| Americans | 0.6 /100 | #268 | Tragic $42,742 |
| Belizeans | 0.5 /100 | #269 | Tragic $42,702 |
| Osage | 0.5 /100 | #270 | Tragic $42,651 |
| Pennsylvania Germans | 0.5 /100 | #271 | Tragic $42,615 |
| Iroquois | 0.4 /100 | #272 | Tragic $42,430 |
| Immigrants | Dominica | 0.4 /100 | #273 | Tragic $42,420 |
| Immigrants | El Salvador | 0.4 /100 | #274 | Tragic $42,413 |
| Immigrants | Belize | 0.3 /100 | #275 | Tragic $42,339 |
| Spanish Americans | 0.3 /100 | #276 | Tragic $42,316 |
Demographics Similar to Immigrants from Iran by Median Earnings
In terms of median earnings, the demographic groups most similar to Immigrants from Iran are Okinawan ($57,550, a difference of 0.11%), Immigrants from South Central Asia ($57,114, a difference of 0.87%), Immigrants from Israel ($57,034, a difference of 1.0%), Immigrants from Ireland ($56,854, a difference of 1.3%), and Iranian ($58,474, a difference of 1.5%).
| Demographics | Rating | Rank | Median Earnings |
| Filipinos | 100.0 /100 | #1 | Exceptional $61,197 |
| Immigrants | Taiwan | 100.0 /100 | #2 | Exceptional $61,151 |
| Immigrants | India | 100.0 /100 | #3 | Exceptional $60,648 |
| Immigrants | Hong Kong | 100.0 /100 | #4 | Exceptional $59,433 |
| Thais | 100.0 /100 | #5 | Exceptional $59,237 |
| Immigrants | Singapore | 100.0 /100 | #6 | Exceptional $59,038 |
| Iranians | 100.0 /100 | #7 | Exceptional $58,474 |
| Immigrants | Iran | 100.0 /100 | #8 | Exceptional $57,612 |
| Okinawans | 100.0 /100 | #9 | Exceptional $57,550 |
| Immigrants | South Central Asia | 100.0 /100 | #10 | Exceptional $57,114 |
| Immigrants | Israel | 100.0 /100 | #11 | Exceptional $57,034 |
| Immigrants | Ireland | 100.0 /100 | #12 | Exceptional $56,854 |
| Immigrants | China | 100.0 /100 | #13 | Exceptional $56,638 |
| Immigrants | Australia | 100.0 /100 | #14 | Exceptional $56,305 |
| Indians (Asian) | 100.0 /100 | #15 | Exceptional $56,253 |