Immigrants from Uganda vs Moroccan Median Earnings
COMPARE
Immigrants from Uganda
Moroccan
Median Earnings
Median Earnings Comparison
Immigrants from Uganda
Moroccans
$48,041
MEDIAN EARNINGS
90.5/ 100
METRIC RATING
133rd/ 347
METRIC RANK
$48,838
MEDIAN EARNINGS
96.7/ 100
METRIC RATING
114th/ 347
METRIC RANK
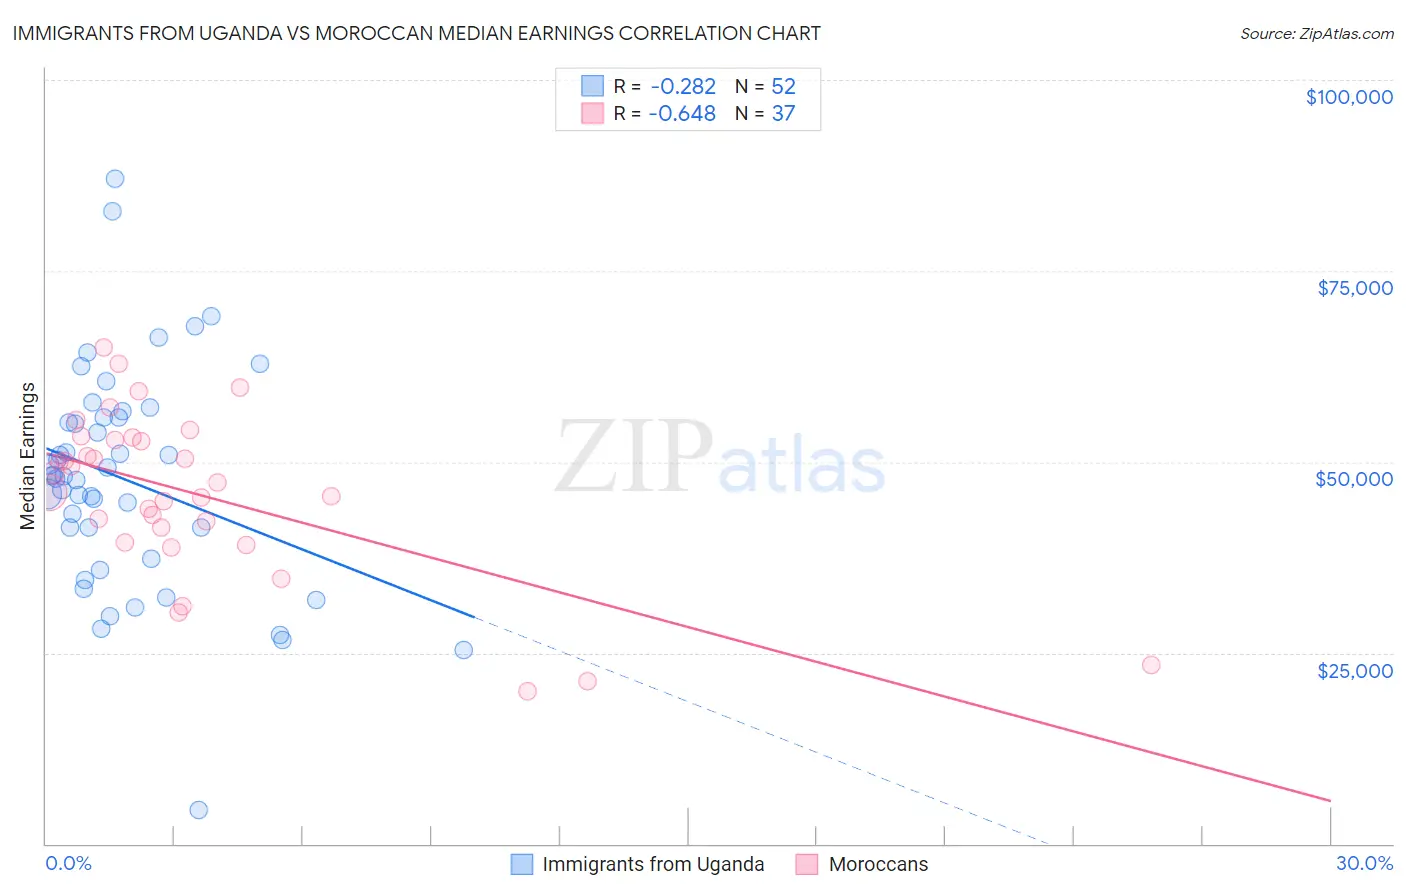
Immigrants from Uganda vs Moroccan Median Earnings Correlation Chart
The statistical analysis conducted on geographies consisting of 125,980,560 people shows a weak negative correlation between the proportion of Immigrants from Uganda and median earnings in the United States with a correlation coefficient (R) of -0.282 and weighted average of $48,041. Similarly, the statistical analysis conducted on geographies consisting of 201,800,770 people shows a significant negative correlation between the proportion of Moroccans and median earnings in the United States with a correlation coefficient (R) of -0.648 and weighted average of $48,838, a difference of 1.7%.
Median Earnings Correlation Summary
| Measurement | Immigrants from Uganda | Moroccan |
| Minimum | $4,426 | $19,886 |
| Maximum | $87,021 | $64,979 |
| Range | $82,595 | $45,093 |
| Mean | $47,722 | $45,820 |
| Median | $48,140 | $47,333 |
| Interquartile 25% (IQ1) | $39,326 | $40,473 |
| Interquartile 75% (IQ3) | $55,755 | $53,052 |
| Interquartile Range (IQR) | $16,429 | $12,578 |
| Standard Deviation (Sample) | $14,671 | $10,819 |
| Standard Deviation (Population) | $14,529 | $10,672 |
Demographics Similar to Immigrants from Uganda and Moroccans by Median Earnings
In terms of median earnings, the demographic groups most similar to Immigrants from Uganda are British ($48,189, a difference of 0.31%), Zimbabwean ($48,229, a difference of 0.39%), Lebanese ($48,226, a difference of 0.39%), Pakistani ($48,254, a difference of 0.44%), and Immigrants from Philippines ($48,266, a difference of 0.47%). Similarly, the demographic groups most similar to Moroccans are Chinese ($48,836, a difference of 0.010%), Immigrants from Kuwait ($48,861, a difference of 0.050%), Korean ($48,727, a difference of 0.23%), Serbian ($48,677, a difference of 0.33%), and Immigrants from Jordan ($48,673, a difference of 0.34%).
| Demographics | Rating | Rank | Median Earnings |
| Immigrants | Kuwait | 96.8 /100 | #113 | Exceptional $48,861 |
| Moroccans | 96.7 /100 | #114 | Exceptional $48,838 |
| Chinese | 96.7 /100 | #115 | Exceptional $48,836 |
| Koreans | 96.2 /100 | #116 | Exceptional $48,727 |
| Serbians | 95.9 /100 | #117 | Exceptional $48,677 |
| Immigrants | Jordan | 95.9 /100 | #118 | Exceptional $48,673 |
| Poles | 95.8 /100 | #119 | Exceptional $48,659 |
| Carpatho Rusyns | 95.5 /100 | #120 | Exceptional $48,617 |
| Arabs | 95.4 /100 | #121 | Exceptional $48,599 |
| Chileans | 94.8 /100 | #122 | Exceptional $48,504 |
| Immigrants | Syria | 93.9 /100 | #123 | Exceptional $48,375 |
| Brazilians | 93.7 /100 | #124 | Exceptional $48,356 |
| Immigrants | Fiji | 93.3 /100 | #125 | Exceptional $48,305 |
| Assyrians/Chaldeans/Syriacs | 93.3 /100 | #126 | Exceptional $48,304 |
| Sierra Leoneans | 93.1 /100 | #127 | Exceptional $48,286 |
| Immigrants | Philippines | 92.9 /100 | #128 | Exceptional $48,266 |
| Pakistanis | 92.8 /100 | #129 | Exceptional $48,254 |
| Zimbabweans | 92.6 /100 | #130 | Exceptional $48,229 |
| Lebanese | 92.5 /100 | #131 | Exceptional $48,226 |
| British | 92.2 /100 | #132 | Exceptional $48,189 |
| Immigrants | Uganda | 90.5 /100 | #133 | Exceptional $48,041 |