Yuman vs Immigrants from Iran Median Earnings
COMPARE
Yuman
Immigrants from Iran
Median Earnings
Median Earnings Comparison
Yuman
Immigrants from Iran
$39,523
MEDIAN EARNINGS
0.0/ 100
METRIC RATING
327th/ 347
METRIC RANK
$57,612
MEDIAN EARNINGS
100.0/ 100
METRIC RATING
8th/ 347
METRIC RANK
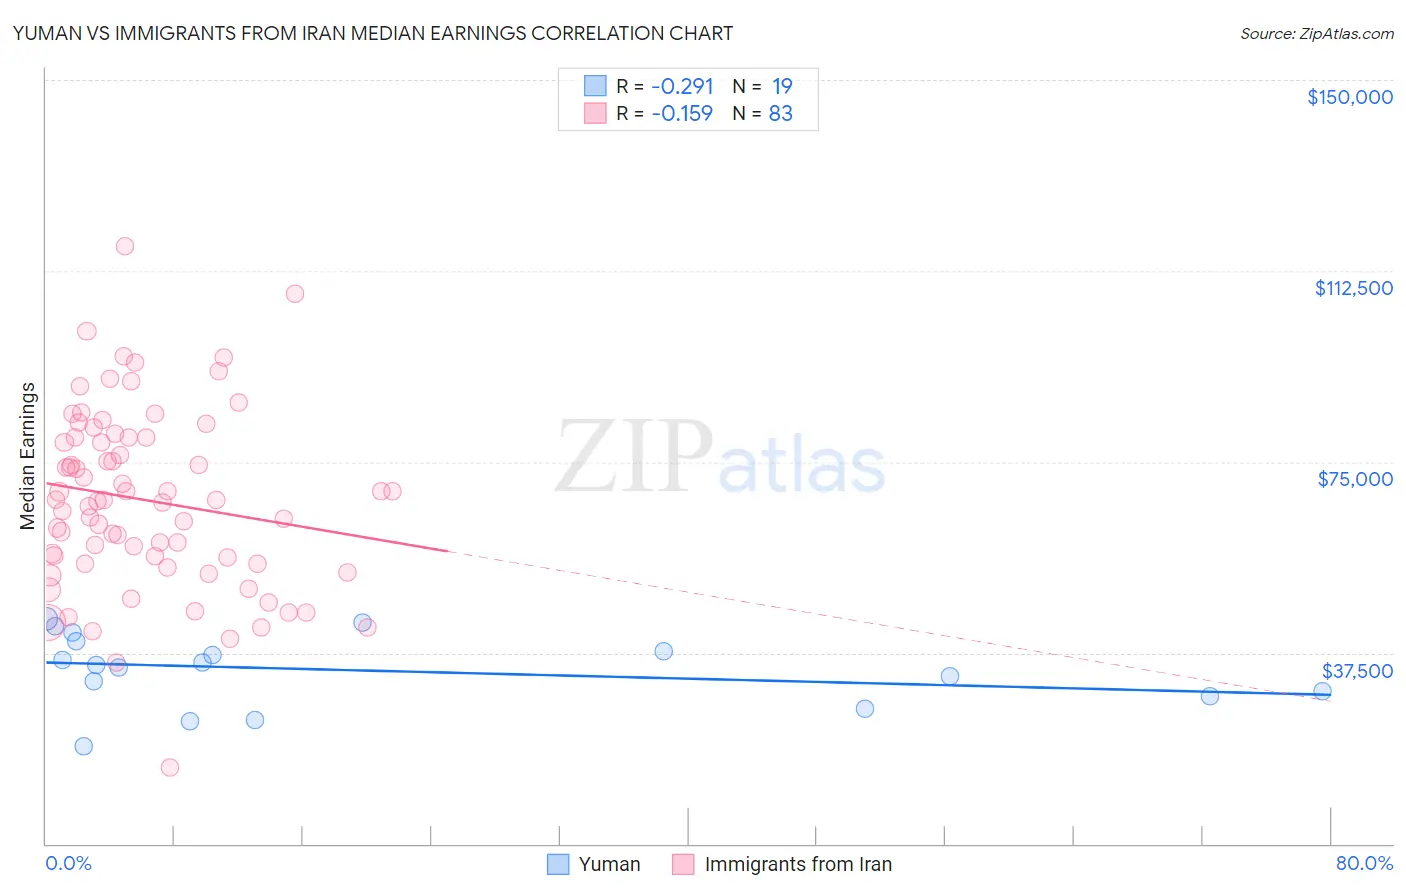
Yuman vs Immigrants from Iran Median Earnings Correlation Chart
The statistical analysis conducted on geographies consisting of 40,694,380 people shows a weak negative correlation between the proportion of Yuman and median earnings in the United States with a correlation coefficient (R) of -0.291 and weighted average of $39,523. Similarly, the statistical analysis conducted on geographies consisting of 279,892,133 people shows a poor negative correlation between the proportion of Immigrants from Iran and median earnings in the United States with a correlation coefficient (R) of -0.159 and weighted average of $57,612, a difference of 45.8%.
Median Earnings Correlation Summary
| Measurement | Yuman | Immigrants from Iran |
| Minimum | $19,239 | $14,861 |
| Maximum | $44,204 | $117,429 |
| Range | $24,965 | $102,568 |
| Mean | $34,023 | $67,470 |
| Median | $35,154 | $67,500 |
| Interquartile 25% (IQ1) | $29,007 | $54,982 |
| Interquartile 75% (IQ3) | $39,859 | $79,813 |
| Interquartile Range (IQR) | $10,852 | $24,831 |
| Standard Deviation (Sample) | $7,101 | $17,753 |
| Standard Deviation (Population) | $6,912 | $17,645 |
Similar Demographics by Median Earnings
Demographics Similar to Yuman by Median Earnings
In terms of median earnings, the demographic groups most similar to Yuman are Immigrants from Yemen ($39,540, a difference of 0.040%), Sioux ($39,448, a difference of 0.19%), Creek ($39,648, a difference of 0.32%), Ottawa ($39,721, a difference of 0.50%), and Bahamian ($39,735, a difference of 0.54%).
| Demographics | Rating | Rank | Median Earnings |
| Immigrants | Bahamas | 0.0 /100 | #320 | Tragic $39,861 |
| Mexicans | 0.0 /100 | #321 | Tragic $39,834 |
| Immigrants | Central America | 0.0 /100 | #322 | Tragic $39,762 |
| Bahamians | 0.0 /100 | #323 | Tragic $39,735 |
| Ottawa | 0.0 /100 | #324 | Tragic $39,721 |
| Creek | 0.0 /100 | #325 | Tragic $39,648 |
| Immigrants | Yemen | 0.0 /100 | #326 | Tragic $39,540 |
| Yuman | 0.0 /100 | #327 | Tragic $39,523 |
| Sioux | 0.0 /100 | #328 | Tragic $39,448 |
| Kiowa | 0.0 /100 | #329 | Tragic $39,232 |
| Immigrants | Congo | 0.0 /100 | #330 | Tragic $39,169 |
| Immigrants | Mexico | 0.0 /100 | #331 | Tragic $39,114 |
| Yakama | 0.0 /100 | #332 | Tragic $39,107 |
| Houma | 0.0 /100 | #333 | Tragic $38,949 |
| Spanish American Indians | 0.0 /100 | #334 | Tragic $38,907 |
Demographics Similar to Immigrants from Iran by Median Earnings
In terms of median earnings, the demographic groups most similar to Immigrants from Iran are Okinawan ($57,550, a difference of 0.11%), Immigrants from South Central Asia ($57,114, a difference of 0.87%), Immigrants from Israel ($57,034, a difference of 1.0%), Immigrants from Ireland ($56,854, a difference of 1.3%), and Iranian ($58,474, a difference of 1.5%).
| Demographics | Rating | Rank | Median Earnings |
| Filipinos | 100.0 /100 | #1 | Exceptional $61,197 |
| Immigrants | Taiwan | 100.0 /100 | #2 | Exceptional $61,151 |
| Immigrants | India | 100.0 /100 | #3 | Exceptional $60,648 |
| Immigrants | Hong Kong | 100.0 /100 | #4 | Exceptional $59,433 |
| Thais | 100.0 /100 | #5 | Exceptional $59,237 |
| Immigrants | Singapore | 100.0 /100 | #6 | Exceptional $59,038 |
| Iranians | 100.0 /100 | #7 | Exceptional $58,474 |
| Immigrants | Iran | 100.0 /100 | #8 | Exceptional $57,612 |
| Okinawans | 100.0 /100 | #9 | Exceptional $57,550 |
| Immigrants | South Central Asia | 100.0 /100 | #10 | Exceptional $57,114 |
| Immigrants | Israel | 100.0 /100 | #11 | Exceptional $57,034 |
| Immigrants | Ireland | 100.0 /100 | #12 | Exceptional $56,854 |
| Immigrants | China | 100.0 /100 | #13 | Exceptional $56,638 |
| Immigrants | Australia | 100.0 /100 | #14 | Exceptional $56,305 |
| Indians (Asian) | 100.0 /100 | #15 | Exceptional $56,253 |