Scotch-Irish vs Immigrants from Iran Median Earnings
COMPARE
Scotch-Irish
Immigrants from Iran
Median Earnings
Median Earnings Comparison
Scotch-Irish
Immigrants from Iran
$44,924
MEDIAN EARNINGS
10.7/ 100
METRIC RATING
229th/ 347
METRIC RANK
$57,612
MEDIAN EARNINGS
100.0/ 100
METRIC RATING
8th/ 347
METRIC RANK
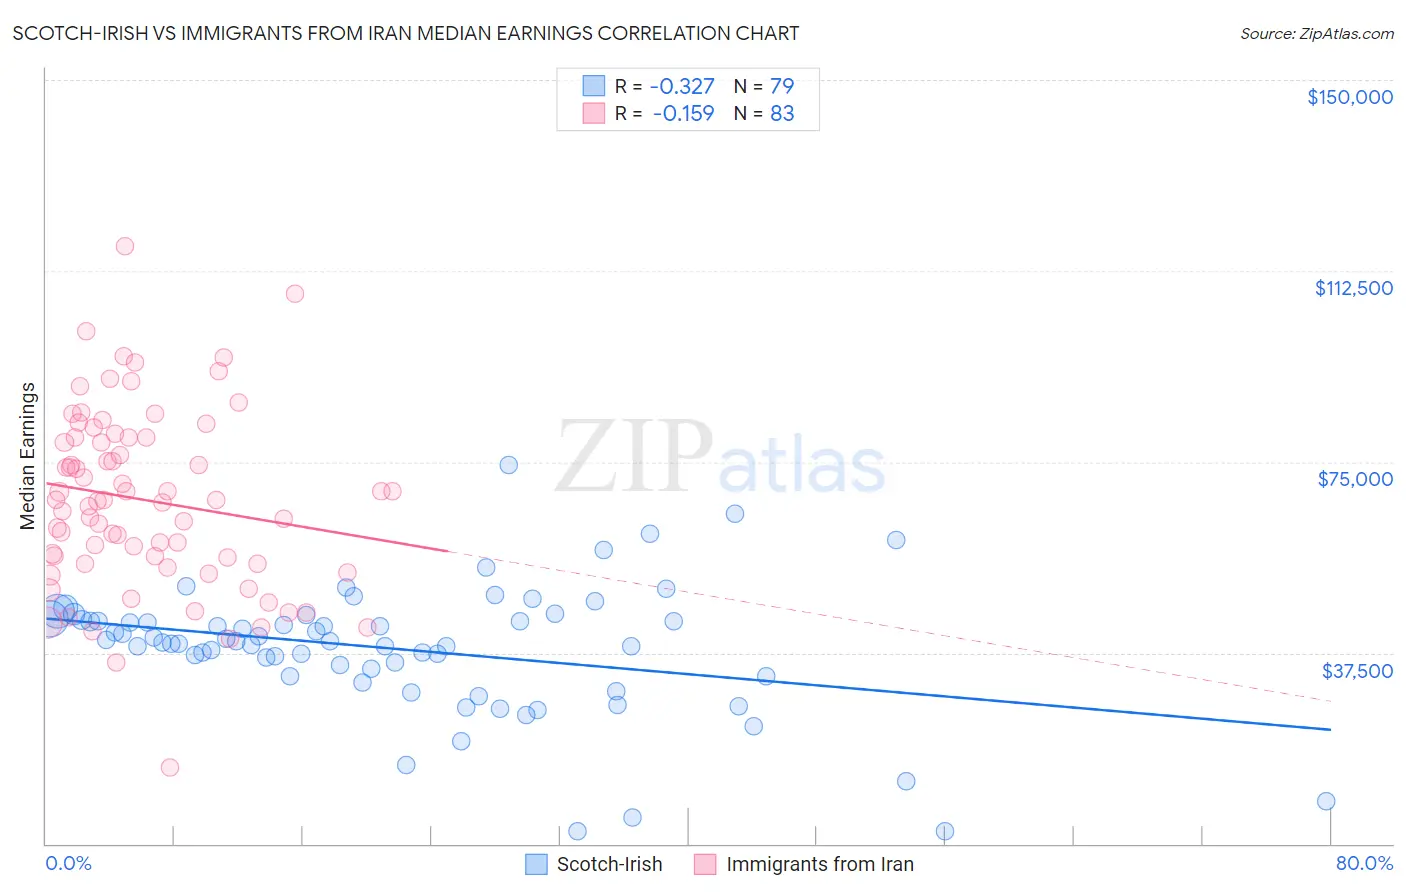
Scotch-Irish vs Immigrants from Iran Median Earnings Correlation Chart
The statistical analysis conducted on geographies consisting of 548,498,961 people shows a mild negative correlation between the proportion of Scotch-Irish and median earnings in the United States with a correlation coefficient (R) of -0.327 and weighted average of $44,924. Similarly, the statistical analysis conducted on geographies consisting of 279,892,133 people shows a poor negative correlation between the proportion of Immigrants from Iran and median earnings in the United States with a correlation coefficient (R) of -0.159 and weighted average of $57,612, a difference of 28.2%.
Median Earnings Correlation Summary
| Measurement | Scotch-Irish | Immigrants from Iran |
| Minimum | $2,499 | $14,861 |
| Maximum | $74,508 | $117,429 |
| Range | $72,009 | $102,568 |
| Mean | $38,268 | $67,470 |
| Median | $39,708 | $67,500 |
| Interquartile 25% (IQ1) | $32,986 | $54,982 |
| Interquartile 75% (IQ3) | $43,991 | $79,813 |
| Interquartile Range (IQR) | $11,005 | $24,831 |
| Standard Deviation (Sample) | $12,720 | $17,753 |
| Standard Deviation (Population) | $12,639 | $17,645 |
Similar Demographics by Median Earnings
Demographics Similar to Scotch-Irish by Median Earnings
In terms of median earnings, the demographic groups most similar to Scotch-Irish are Immigrants from Western Africa ($44,893, a difference of 0.070%), Immigrants from Iraq ($44,988, a difference of 0.14%), Japanese ($44,825, a difference of 0.22%), Native Hawaiian ($45,027, a difference of 0.23%), and Immigrants from Nigeria ($45,030, a difference of 0.24%).
| Demographics | Rating | Rank | Median Earnings |
| Immigrants | Panama | 15.0 /100 | #222 | Poor $45,198 |
| Whites/Caucasians | 15.0 /100 | #223 | Poor $45,197 |
| West Indians | 13.9 /100 | #224 | Poor $45,132 |
| Immigrants | Cambodia | 13.2 /100 | #225 | Poor $45,090 |
| Immigrants | Nigeria | 12.2 /100 | #226 | Poor $45,030 |
| Native Hawaiians | 12.2 /100 | #227 | Poor $45,027 |
| Immigrants | Iraq | 11.6 /100 | #228 | Poor $44,988 |
| Scotch-Irish | 10.7 /100 | #229 | Poor $44,924 |
| Immigrants | Western Africa | 10.3 /100 | #230 | Poor $44,893 |
| Japanese | 9.5 /100 | #231 | Tragic $44,825 |
| Delaware | 9.0 /100 | #232 | Tragic $44,783 |
| Immigrants | Sudan | 8.8 /100 | #233 | Tragic $44,767 |
| Cape Verdeans | 7.5 /100 | #234 | Tragic $44,640 |
| Venezuelans | 6.9 /100 | #235 | Tragic $44,580 |
| British West Indians | 6.7 /100 | #236 | Tragic $44,552 |
Demographics Similar to Immigrants from Iran by Median Earnings
In terms of median earnings, the demographic groups most similar to Immigrants from Iran are Okinawan ($57,550, a difference of 0.11%), Immigrants from South Central Asia ($57,114, a difference of 0.87%), Immigrants from Israel ($57,034, a difference of 1.0%), Immigrants from Ireland ($56,854, a difference of 1.3%), and Iranian ($58,474, a difference of 1.5%).
| Demographics | Rating | Rank | Median Earnings |
| Filipinos | 100.0 /100 | #1 | Exceptional $61,197 |
| Immigrants | Taiwan | 100.0 /100 | #2 | Exceptional $61,151 |
| Immigrants | India | 100.0 /100 | #3 | Exceptional $60,648 |
| Immigrants | Hong Kong | 100.0 /100 | #4 | Exceptional $59,433 |
| Thais | 100.0 /100 | #5 | Exceptional $59,237 |
| Immigrants | Singapore | 100.0 /100 | #6 | Exceptional $59,038 |
| Iranians | 100.0 /100 | #7 | Exceptional $58,474 |
| Immigrants | Iran | 100.0 /100 | #8 | Exceptional $57,612 |
| Okinawans | 100.0 /100 | #9 | Exceptional $57,550 |
| Immigrants | South Central Asia | 100.0 /100 | #10 | Exceptional $57,114 |
| Immigrants | Israel | 100.0 /100 | #11 | Exceptional $57,034 |
| Immigrants | Ireland | 100.0 /100 | #12 | Exceptional $56,854 |
| Immigrants | China | 100.0 /100 | #13 | Exceptional $56,638 |
| Immigrants | Australia | 100.0 /100 | #14 | Exceptional $56,305 |
| Indians (Asian) | 100.0 /100 | #15 | Exceptional $56,253 |