Immigrants from Argentina vs Bermudan Median Earnings
COMPARE
Immigrants from Argentina
Bermudan
Median Earnings
Median Earnings Comparison
Immigrants from Argentina
Bermudans
$49,841
MEDIAN EARNINGS
99.2/ 100
METRIC RATING
92nd/ 347
METRIC RANK
$45,593
MEDIAN EARNINGS
23.5/ 100
METRIC RATING
212th/ 347
METRIC RANK
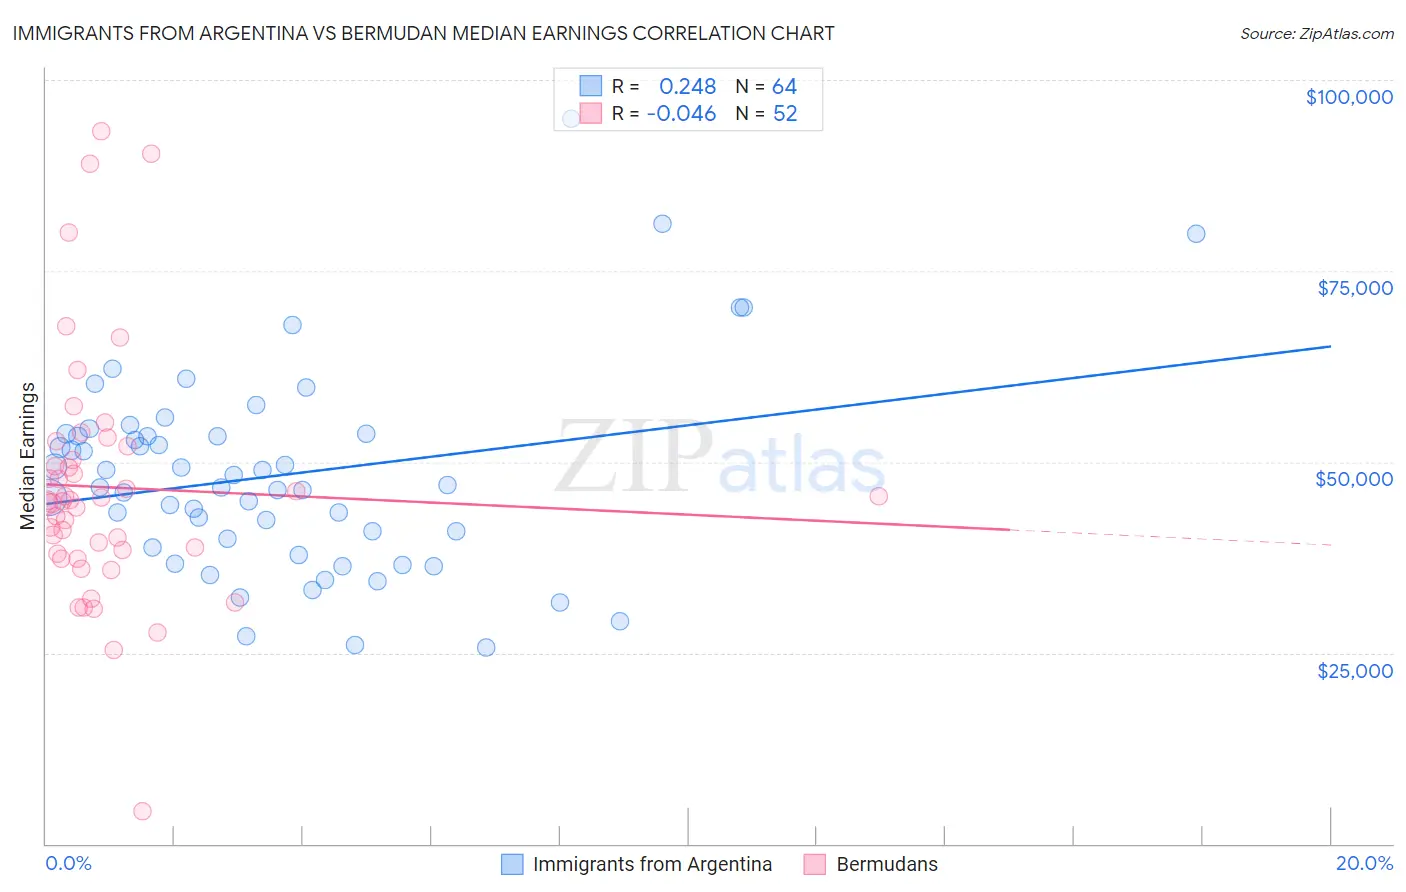
Immigrants from Argentina vs Bermudan Median Earnings Correlation Chart
The statistical analysis conducted on geographies consisting of 264,409,503 people shows a weak positive correlation between the proportion of Immigrants from Argentina and median earnings in the United States with a correlation coefficient (R) of 0.248 and weighted average of $49,841. Similarly, the statistical analysis conducted on geographies consisting of 55,730,379 people shows no correlation between the proportion of Bermudans and median earnings in the United States with a correlation coefficient (R) of -0.046 and weighted average of $45,593, a difference of 9.3%.
Median Earnings Correlation Summary
| Measurement | Immigrants from Argentina | Bermudan |
| Minimum | $25,634 | $4,250 |
| Maximum | $94,961 | $93,350 |
| Range | $69,327 | $89,100 |
| Mean | $48,229 | $46,670 |
| Median | $46,837 | $44,943 |
| Interquartile 25% (IQ1) | $39,341 | $38,258 |
| Interquartile 75% (IQ3) | $53,567 | $51,130 |
| Interquartile Range (IQR) | $14,226 | $12,872 |
| Standard Deviation (Sample) | $13,180 | $16,028 |
| Standard Deviation (Population) | $13,077 | $15,873 |
Similar Demographics by Median Earnings
Demographics Similar to Immigrants from Argentina by Median Earnings
In terms of median earnings, the demographic groups most similar to Immigrants from Argentina are Armenian ($49,804, a difference of 0.070%), Macedonian ($49,893, a difference of 0.11%), Italian ($49,915, a difference of 0.15%), Croatian ($49,724, a difference of 0.23%), and Immigrants from England ($49,722, a difference of 0.24%).
| Demographics | Rating | Rank | Median Earnings |
| Immigrants | Kazakhstan | 99.5 /100 | #85 | Exceptional $50,225 |
| Immigrants | Canada | 99.5 /100 | #86 | Exceptional $50,192 |
| Immigrants | Uzbekistan | 99.5 /100 | #87 | Exceptional $50,151 |
| Albanians | 99.4 /100 | #88 | Exceptional $50,116 |
| Immigrants | North America | 99.4 /100 | #89 | Exceptional $50,108 |
| Italians | 99.3 /100 | #90 | Exceptional $49,915 |
| Macedonians | 99.2 /100 | #91 | Exceptional $49,893 |
| Immigrants | Argentina | 99.2 /100 | #92 | Exceptional $49,841 |
| Armenians | 99.1 /100 | #93 | Exceptional $49,804 |
| Croatians | 99.0 /100 | #94 | Exceptional $49,724 |
| Immigrants | England | 99.0 /100 | #95 | Exceptional $49,722 |
| Immigrants | Lebanon | 99.0 /100 | #96 | Exceptional $49,682 |
| Immigrants | North Macedonia | 98.9 /100 | #97 | Exceptional $49,658 |
| Immigrants | Northern Africa | 98.9 /100 | #98 | Exceptional $49,648 |
| Immigrants | Afghanistan | 98.9 /100 | #99 | Exceptional $49,645 |
Demographics Similar to Bermudans by Median Earnings
In terms of median earnings, the demographic groups most similar to Bermudans are Panamanian ($45,593, a difference of 0.0%), Immigrants from Bosnia and Herzegovina ($45,600, a difference of 0.010%), Immigrants from Thailand ($45,598, a difference of 0.010%), Immigrants from Grenada ($45,596, a difference of 0.010%), and Immigrants from Senegal ($45,611, a difference of 0.040%).
| Demographics | Rating | Rank | Median Earnings |
| Tongans | 25.4 /100 | #205 | Fair $45,665 |
| Immigrants | Ghana | 24.8 /100 | #206 | Fair $45,641 |
| Immigrants | Senegal | 24.0 /100 | #207 | Fair $45,611 |
| Immigrants | Bosnia and Herzegovina | 23.7 /100 | #208 | Fair $45,600 |
| Immigrants | Thailand | 23.7 /100 | #209 | Fair $45,598 |
| Immigrants | Grenada | 23.6 /100 | #210 | Fair $45,596 |
| Panamanians | 23.5 /100 | #211 | Fair $45,593 |
| Bermudans | 23.5 /100 | #212 | Fair $45,593 |
| Immigrants | Colombia | 22.4 /100 | #213 | Fair $45,550 |
| Nigerians | 22.0 /100 | #214 | Fair $45,532 |
| Immigrants | Bangladesh | 22.0 /100 | #215 | Fair $45,532 |
| Guyanese | 20.6 /100 | #216 | Fair $45,470 |
| Tlingit-Haida | 20.5 /100 | #217 | Fair $45,468 |
| Spanish | 19.7 /100 | #218 | Poor $45,432 |
| Dutch | 18.4 /100 | #219 | Poor $45,370 |