Immigrants from Sudan vs Bermudan Householder Income Ages 25 - 44 years
COMPARE
Immigrants from Sudan
Bermudan
Householder Income Ages 25 - 44 years
Householder Income Ages 25 - 44 years Comparison
Immigrants from Sudan
Bermudans
$86,109
HOUSEHOLDER INCOME AGES 25 - 44 YEARS
0.9/ 100
METRIC RATING
248th/ 347
METRIC RANK
$88,231
HOUSEHOLDER INCOME AGES 25 - 44 YEARS
2.9/ 100
METRIC RATING
235th/ 347
METRIC RANK
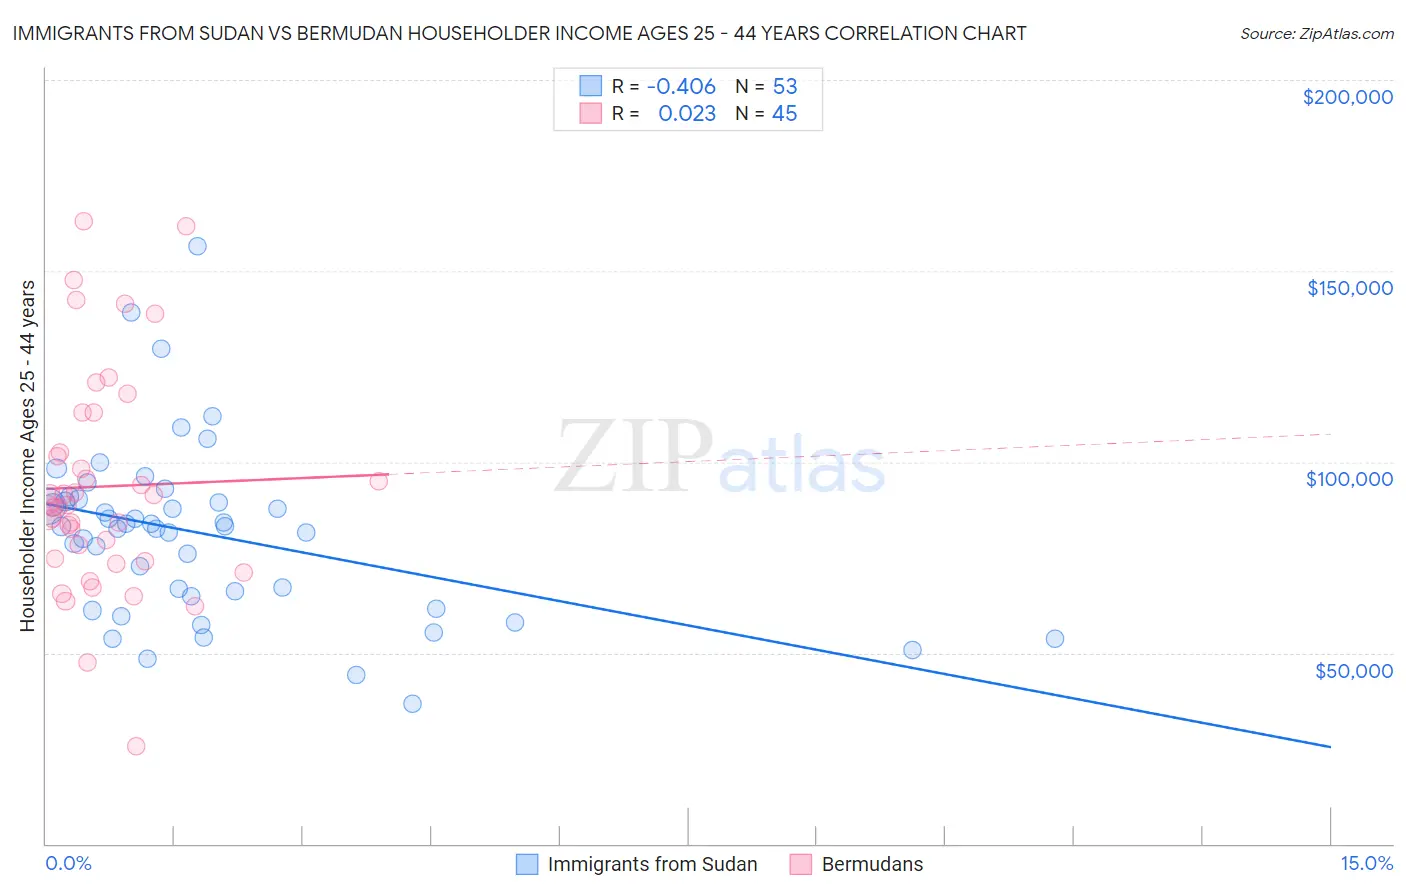
Immigrants from Sudan vs Bermudan Householder Income Ages 25 - 44 years Correlation Chart
The statistical analysis conducted on geographies consisting of 118,898,989 people shows a moderate negative correlation between the proportion of Immigrants from Sudan and household income with householder between the ages 25 and 44 in the United States with a correlation coefficient (R) of -0.406 and weighted average of $86,109. Similarly, the statistical analysis conducted on geographies consisting of 55,699,004 people shows no correlation between the proportion of Bermudans and household income with householder between the ages 25 and 44 in the United States with a correlation coefficient (R) of 0.023 and weighted average of $88,231, a difference of 2.5%.
Householder Income Ages 25 - 44 years Correlation Summary
| Measurement | Immigrants from Sudan | Bermudan |
| Minimum | $36,667 | $25,615 |
| Maximum | $156,518 | $163,159 |
| Range | $119,851 | $137,544 |
| Mean | $80,997 | $93,543 |
| Median | $83,128 | $88,641 |
| Interquartile 25% (IQ1) | $63,223 | $74,251 |
| Interquartile 75% (IQ3) | $89,871 | $107,790 |
| Interquartile Range (IQR) | $26,648 | $33,539 |
| Standard Deviation (Sample) | $22,850 | $28,803 |
| Standard Deviation (Population) | $22,634 | $28,481 |
Demographics Similar to Immigrants from Sudan and Bermudans by Householder Income Ages 25 - 44 years
In terms of householder income ages 25 - 44 years, the demographic groups most similar to Immigrants from Sudan are French American Indian ($85,899, a difference of 0.24%), Pennsylvania German ($85,836, a difference of 0.32%), Cape Verdean ($85,758, a difference of 0.41%), Immigrants from Nigeria ($86,589, a difference of 0.56%), and Immigrants from Burma/Myanmar ($86,736, a difference of 0.73%). Similarly, the demographic groups most similar to Bermudans are Venezuelan ($88,232, a difference of 0.0%), Immigrants from Cameroon ($88,214, a difference of 0.020%), Salvadoran ($88,198, a difference of 0.040%), Malaysian ($88,291, a difference of 0.070%), and Nonimmigrants ($88,301, a difference of 0.080%).
| Demographics | Rating | Rank | Householder Income Ages 25 - 44 years |
| Immigrants | Grenada | 3.0 /100 | #231 | Tragic $88,311 |
| Immigrants | Nonimmigrants | 3.0 /100 | #232 | Tragic $88,301 |
| Malaysians | 3.0 /100 | #233 | Tragic $88,291 |
| Venezuelans | 2.9 /100 | #234 | Tragic $88,232 |
| Bermudans | 2.9 /100 | #235 | Tragic $88,231 |
| Immigrants | Cameroon | 2.9 /100 | #236 | Tragic $88,214 |
| Salvadorans | 2.8 /100 | #237 | Tragic $88,198 |
| Alaska Natives | 2.6 /100 | #238 | Tragic $88,018 |
| Immigrants | Ghana | 2.2 /100 | #239 | Tragic $87,760 |
| Nicaraguans | 2.2 /100 | #240 | Tragic $87,751 |
| Nigerians | 2.2 /100 | #241 | Tragic $87,730 |
| West Indians | 1.7 /100 | #242 | Tragic $87,205 |
| Immigrants | West Indies | 1.5 /100 | #243 | Tragic $87,063 |
| Immigrants | Venezuela | 1.5 /100 | #244 | Tragic $87,038 |
| Immigrants | El Salvador | 1.4 /100 | #245 | Tragic $86,913 |
| Immigrants | Burma/Myanmar | 1.3 /100 | #246 | Tragic $86,736 |
| Immigrants | Nigeria | 1.2 /100 | #247 | Tragic $86,589 |
| Immigrants | Sudan | 0.9 /100 | #248 | Tragic $86,109 |
| French American Indians | 0.8 /100 | #249 | Tragic $85,899 |
| Pennsylvania Germans | 0.8 /100 | #250 | Tragic $85,836 |
| Cape Verdeans | 0.8 /100 | #251 | Tragic $85,758 |