Arapaho vs Bermudan Median Earnings
COMPARE
Arapaho
Bermudan
Median Earnings
Median Earnings Comparison
Arapaho
Bermudans
$36,586
MEDIAN EARNINGS
0.0/ 100
METRIC RATING
344th/ 347
METRIC RANK
$45,593
MEDIAN EARNINGS
23.5/ 100
METRIC RATING
212th/ 347
METRIC RANK
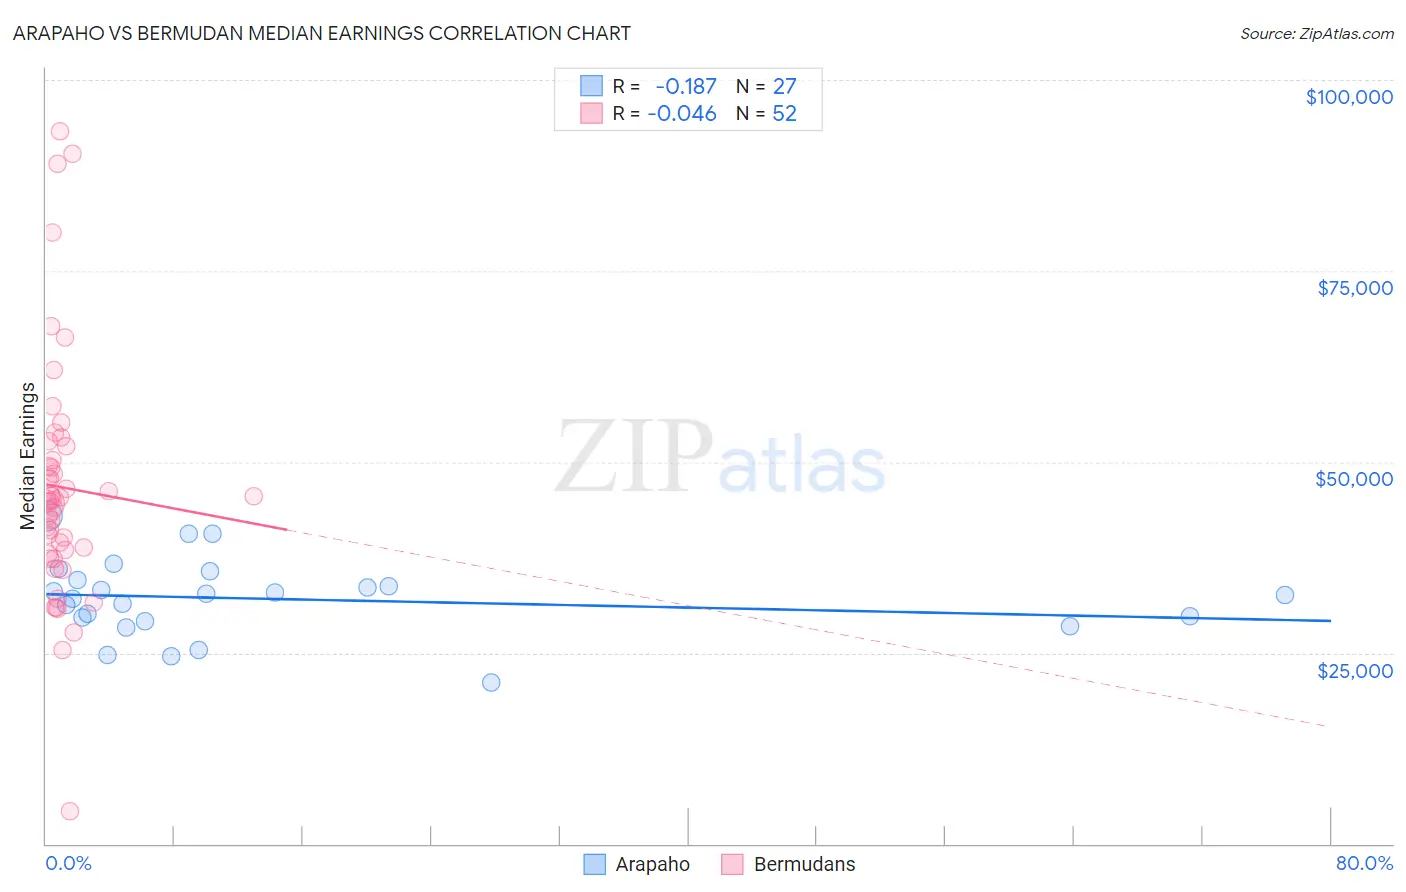
Arapaho vs Bermudan Median Earnings Correlation Chart
The statistical analysis conducted on geographies consisting of 29,778,965 people shows a poor negative correlation between the proportion of Arapaho and median earnings in the United States with a correlation coefficient (R) of -0.187 and weighted average of $36,586. Similarly, the statistical analysis conducted on geographies consisting of 55,730,379 people shows no correlation between the proportion of Bermudans and median earnings in the United States with a correlation coefficient (R) of -0.046 and weighted average of $45,593, a difference of 24.6%.
Median Earnings Correlation Summary
| Measurement | Arapaho | Bermudan |
| Minimum | $21,094 | $4,250 |
| Maximum | $42,957 | $93,350 |
| Range | $21,863 | $89,100 |
| Mean | $32,041 | $46,670 |
| Median | $32,563 | $44,943 |
| Interquartile 25% (IQ1) | $29,178 | $38,258 |
| Interquartile 75% (IQ3) | $34,586 | $51,130 |
| Interquartile Range (IQR) | $5,408 | $12,872 |
| Standard Deviation (Sample) | $5,015 | $16,028 |
| Standard Deviation (Population) | $4,921 | $15,873 |
Similar Demographics by Median Earnings
Demographics Similar to Arapaho by Median Earnings
In terms of median earnings, the demographic groups most similar to Arapaho are Tohono O'odham ($36,349, a difference of 0.65%), Pueblo ($36,859, a difference of 0.75%), Hopi ($36,871, a difference of 0.78%), Lumbee ($36,876, a difference of 0.79%), and Navajo ($36,999, a difference of 1.1%).
| Demographics | Rating | Rank | Median Earnings |
| Houma | 0.0 /100 | #333 | Tragic $38,949 |
| Spanish American Indians | 0.0 /100 | #334 | Tragic $38,907 |
| Natives/Alaskans | 0.0 /100 | #335 | Tragic $38,896 |
| Crow | 0.0 /100 | #336 | Tragic $38,707 |
| Immigrants | Cuba | 0.0 /100 | #337 | Tragic $38,426 |
| Pima | 0.0 /100 | #338 | Tragic $38,285 |
| Menominee | 0.0 /100 | #339 | Tragic $37,884 |
| Navajo | 0.0 /100 | #340 | Tragic $36,999 |
| Lumbee | 0.0 /100 | #341 | Tragic $36,876 |
| Hopi | 0.0 /100 | #342 | Tragic $36,871 |
| Pueblo | 0.0 /100 | #343 | Tragic $36,859 |
| Arapaho | 0.0 /100 | #344 | Tragic $36,586 |
| Tohono O'odham | 0.0 /100 | #345 | Tragic $36,349 |
| Yup'ik | 0.0 /100 | #346 | Tragic $35,942 |
| Puerto Ricans | 0.0 /100 | #347 | Tragic $35,560 |
Demographics Similar to Bermudans by Median Earnings
In terms of median earnings, the demographic groups most similar to Bermudans are Panamanian ($45,593, a difference of 0.0%), Immigrants from Bosnia and Herzegovina ($45,600, a difference of 0.010%), Immigrants from Thailand ($45,598, a difference of 0.010%), Immigrants from Grenada ($45,596, a difference of 0.010%), and Immigrants from Senegal ($45,611, a difference of 0.040%).
| Demographics | Rating | Rank | Median Earnings |
| Tongans | 25.4 /100 | #205 | Fair $45,665 |
| Immigrants | Ghana | 24.8 /100 | #206 | Fair $45,641 |
| Immigrants | Senegal | 24.0 /100 | #207 | Fair $45,611 |
| Immigrants | Bosnia and Herzegovina | 23.7 /100 | #208 | Fair $45,600 |
| Immigrants | Thailand | 23.7 /100 | #209 | Fair $45,598 |
| Immigrants | Grenada | 23.6 /100 | #210 | Fair $45,596 |
| Panamanians | 23.5 /100 | #211 | Fair $45,593 |
| Bermudans | 23.5 /100 | #212 | Fair $45,593 |
| Immigrants | Colombia | 22.4 /100 | #213 | Fair $45,550 |
| Nigerians | 22.0 /100 | #214 | Fair $45,532 |
| Immigrants | Bangladesh | 22.0 /100 | #215 | Fair $45,532 |
| Guyanese | 20.6 /100 | #216 | Fair $45,470 |
| Tlingit-Haida | 20.5 /100 | #217 | Fair $45,468 |
| Spanish | 19.7 /100 | #218 | Poor $45,432 |
| Dutch | 18.4 /100 | #219 | Poor $45,370 |