Immigrants from Western Asia vs Bermudan Median Earnings
COMPARE
Immigrants from Western Asia
Bermudan
Median Earnings
Median Earnings Comparison
Immigrants from Western Asia
Bermudans
$49,389
MEDIAN EARNINGS
98.4/ 100
METRIC RATING
105th/ 347
METRIC RANK
$45,593
MEDIAN EARNINGS
23.5/ 100
METRIC RATING
212th/ 347
METRIC RANK
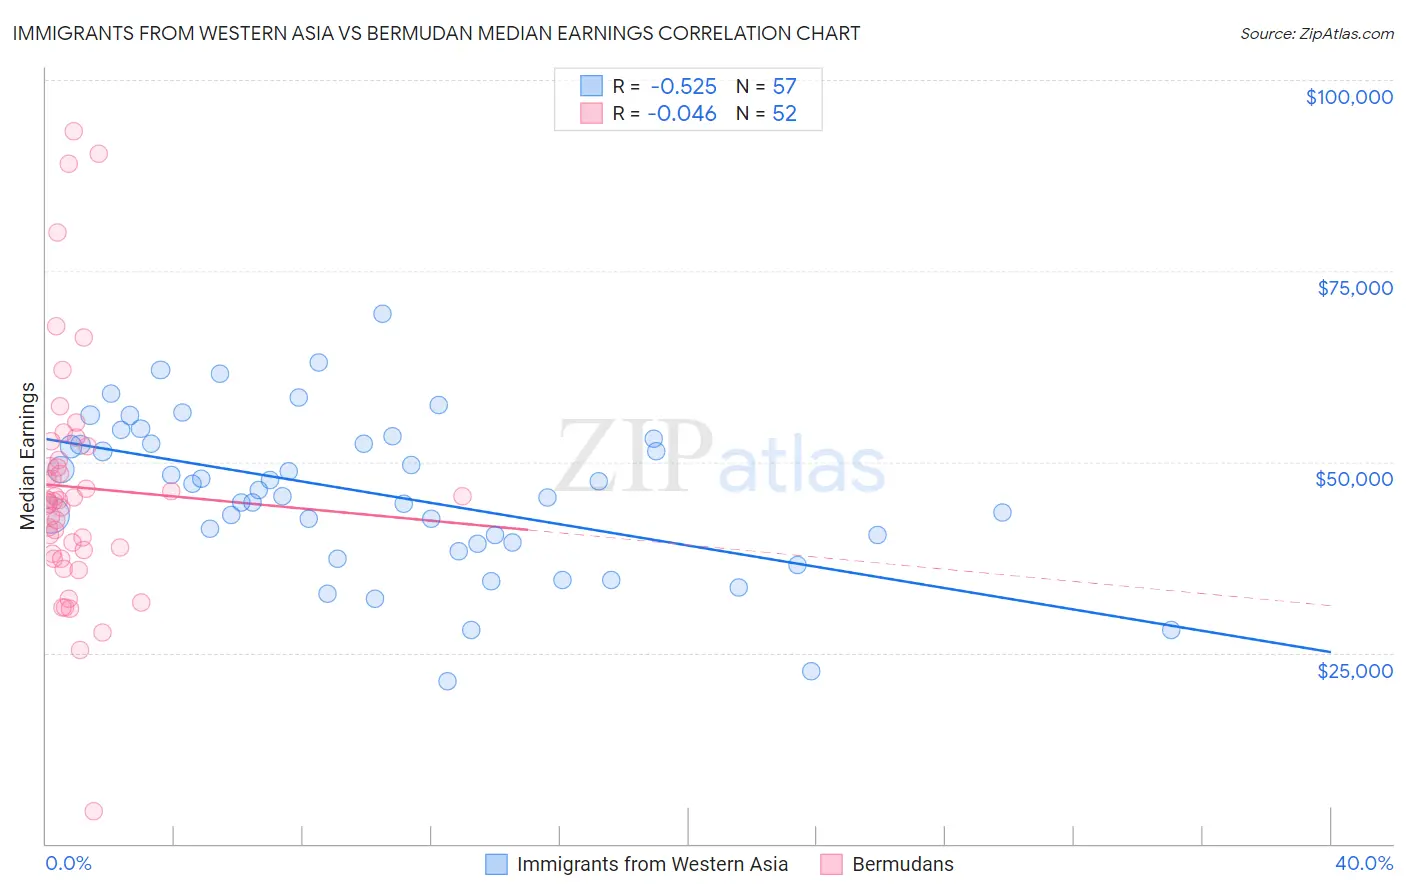
Immigrants from Western Asia vs Bermudan Median Earnings Correlation Chart
The statistical analysis conducted on geographies consisting of 404,426,866 people shows a substantial negative correlation between the proportion of Immigrants from Western Asia and median earnings in the United States with a correlation coefficient (R) of -0.525 and weighted average of $49,389. Similarly, the statistical analysis conducted on geographies consisting of 55,730,379 people shows no correlation between the proportion of Bermudans and median earnings in the United States with a correlation coefficient (R) of -0.046 and weighted average of $45,593, a difference of 8.3%.
Median Earnings Correlation Summary
| Measurement | Immigrants from Western Asia | Bermudan |
| Minimum | $21,250 | $4,250 |
| Maximum | $69,348 | $93,350 |
| Range | $48,098 | $89,100 |
| Mean | $45,817 | $46,670 |
| Median | $46,307 | $44,943 |
| Interquartile 25% (IQ1) | $39,374 | $38,258 |
| Interquartile 75% (IQ3) | $52,673 | $51,130 |
| Interquartile Range (IQR) | $13,299 | $12,872 |
| Standard Deviation (Sample) | $10,167 | $16,028 |
| Standard Deviation (Population) | $10,077 | $15,873 |
Similar Demographics by Median Earnings
Demographics Similar to Immigrants from Western Asia by Median Earnings
In terms of median earnings, the demographic groups most similar to Immigrants from Western Asia are Immigrants from Albania ($49,377, a difference of 0.020%), Immigrants from Morocco ($49,368, a difference of 0.040%), Immigrants from Brazil ($49,463, a difference of 0.15%), Austrian ($49,501, a difference of 0.23%), and Ethiopian ($49,572, a difference of 0.37%).
| Demographics | Rating | Rank | Median Earnings |
| Immigrants | Northern Africa | 98.9 /100 | #98 | Exceptional $49,648 |
| Immigrants | Afghanistan | 98.9 /100 | #99 | Exceptional $49,645 |
| Immigrants | Poland | 98.9 /100 | #100 | Exceptional $49,633 |
| Jordanians | 98.9 /100 | #101 | Exceptional $49,632 |
| Ethiopians | 98.8 /100 | #102 | Exceptional $49,572 |
| Austrians | 98.7 /100 | #103 | Exceptional $49,501 |
| Immigrants | Brazil | 98.6 /100 | #104 | Exceptional $49,463 |
| Immigrants | Western Asia | 98.4 /100 | #105 | Exceptional $49,389 |
| Immigrants | Albania | 98.4 /100 | #106 | Exceptional $49,377 |
| Immigrants | Morocco | 98.4 /100 | #107 | Exceptional $49,368 |
| Palestinians | 98.0 /100 | #108 | Exceptional $49,209 |
| Syrians | 97.1 /100 | #109 | Exceptional $48,934 |
| Immigrants | Ethiopia | 97.1 /100 | #110 | Exceptional $48,924 |
| Immigrants | Zimbabwe | 97.0 /100 | #111 | Exceptional $48,913 |
| Northern Europeans | 96.9 /100 | #112 | Exceptional $48,887 |
Demographics Similar to Bermudans by Median Earnings
In terms of median earnings, the demographic groups most similar to Bermudans are Panamanian ($45,593, a difference of 0.0%), Immigrants from Bosnia and Herzegovina ($45,600, a difference of 0.010%), Immigrants from Thailand ($45,598, a difference of 0.010%), Immigrants from Grenada ($45,596, a difference of 0.010%), and Immigrants from Senegal ($45,611, a difference of 0.040%).
| Demographics | Rating | Rank | Median Earnings |
| Tongans | 25.4 /100 | #205 | Fair $45,665 |
| Immigrants | Ghana | 24.8 /100 | #206 | Fair $45,641 |
| Immigrants | Senegal | 24.0 /100 | #207 | Fair $45,611 |
| Immigrants | Bosnia and Herzegovina | 23.7 /100 | #208 | Fair $45,600 |
| Immigrants | Thailand | 23.7 /100 | #209 | Fair $45,598 |
| Immigrants | Grenada | 23.6 /100 | #210 | Fair $45,596 |
| Panamanians | 23.5 /100 | #211 | Fair $45,593 |
| Bermudans | 23.5 /100 | #212 | Fair $45,593 |
| Immigrants | Colombia | 22.4 /100 | #213 | Fair $45,550 |
| Nigerians | 22.0 /100 | #214 | Fair $45,532 |
| Immigrants | Bangladesh | 22.0 /100 | #215 | Fair $45,532 |
| Guyanese | 20.6 /100 | #216 | Fair $45,470 |
| Tlingit-Haida | 20.5 /100 | #217 | Fair $45,468 |
| Spanish | 19.7 /100 | #218 | Poor $45,432 |
| Dutch | 18.4 /100 | #219 | Poor $45,370 |