Iraqi vs Bermudan Median Earnings
COMPARE
Iraqi
Bermudan
Median Earnings
Median Earnings Comparison
Iraqis
Bermudans
$46,140
MEDIAN EARNINGS
39.9/ 100
METRIC RATING
187th/ 347
METRIC RANK
$45,593
MEDIAN EARNINGS
23.5/ 100
METRIC RATING
212th/ 347
METRIC RANK
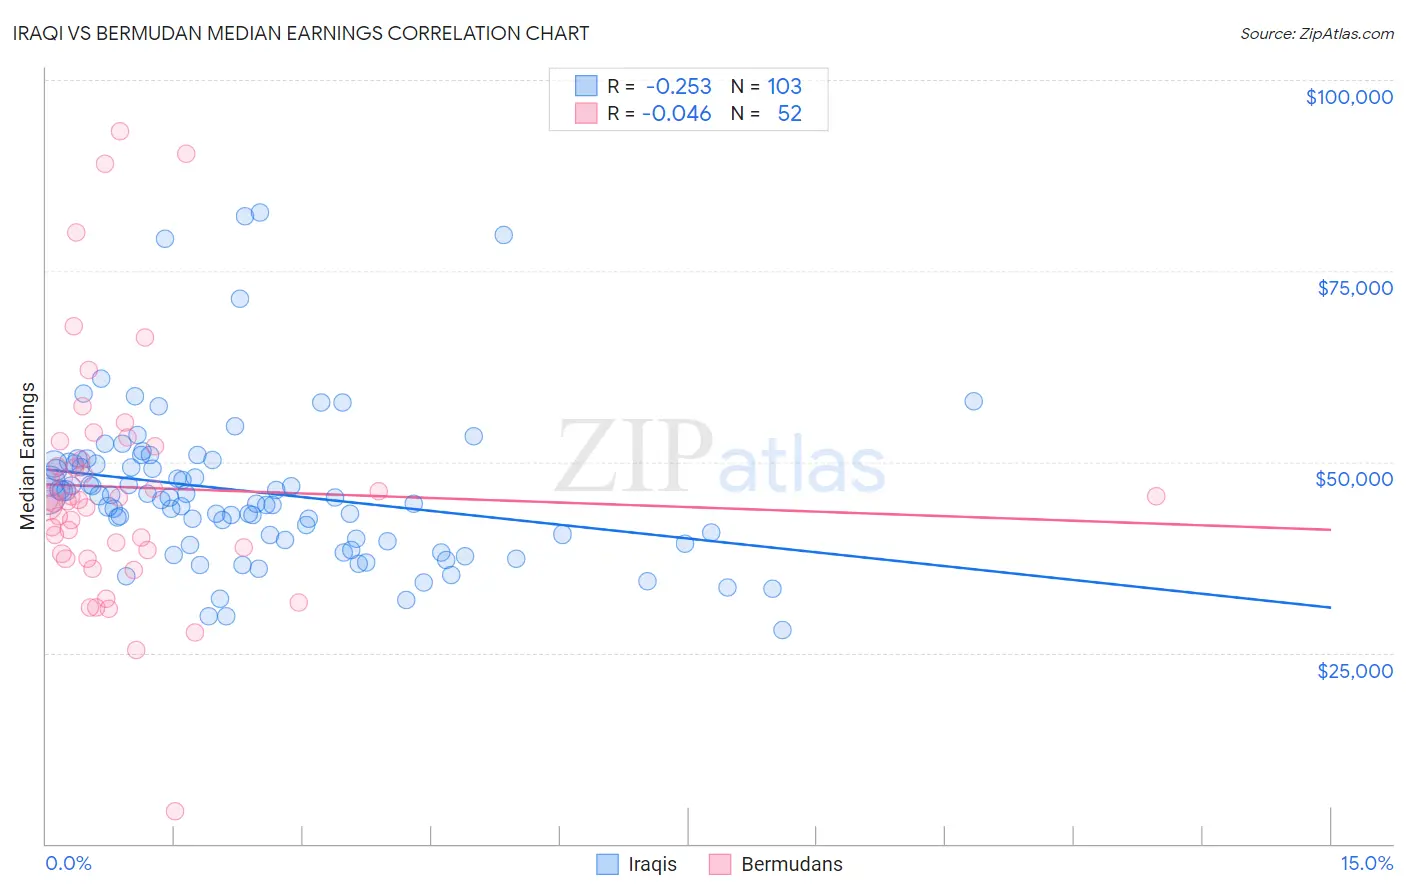
Iraqi vs Bermudan Median Earnings Correlation Chart
The statistical analysis conducted on geographies consisting of 170,634,576 people shows a weak negative correlation between the proportion of Iraqis and median earnings in the United States with a correlation coefficient (R) of -0.253 and weighted average of $46,140. Similarly, the statistical analysis conducted on geographies consisting of 55,730,379 people shows no correlation between the proportion of Bermudans and median earnings in the United States with a correlation coefficient (R) of -0.046 and weighted average of $45,593, a difference of 1.2%.
Median Earnings Correlation Summary
| Measurement | Iraqi | Bermudan |
| Minimum | $27,932 | $4,250 |
| Maximum | $82,727 | $93,350 |
| Range | $54,795 | $89,100 |
| Mean | $46,064 | $46,670 |
| Median | $45,313 | $44,943 |
| Interquartile 25% (IQ1) | $39,685 | $38,258 |
| Interquartile 75% (IQ3) | $49,745 | $51,130 |
| Interquartile Range (IQR) | $10,060 | $12,872 |
| Standard Deviation (Sample) | $10,188 | $16,028 |
| Standard Deviation (Population) | $10,138 | $15,873 |
Similar Demographics by Median Earnings
Demographics Similar to Iraqis by Median Earnings
In terms of median earnings, the demographic groups most similar to Iraqis are Vietnamese ($46,172, a difference of 0.070%), Immigrants from Armenia ($46,094, a difference of 0.10%), Uruguayan ($46,190, a difference of 0.11%), Immigrants from Kenya ($46,214, a difference of 0.16%), and Spaniard ($46,059, a difference of 0.18%).
| Demographics | Rating | Rank | Median Earnings |
| Puget Sound Salish | 46.5 /100 | #180 | Average $46,333 |
| Immigrants | Cameroon | 46.4 /100 | #181 | Average $46,329 |
| Swiss | 45.9 /100 | #182 | Average $46,315 |
| French | 45.2 /100 | #183 | Average $46,296 |
| Immigrants | Kenya | 42.4 /100 | #184 | Average $46,214 |
| Uruguayans | 41.6 /100 | #185 | Average $46,190 |
| Vietnamese | 40.9 /100 | #186 | Average $46,172 |
| Iraqis | 39.9 /100 | #187 | Fair $46,140 |
| Immigrants | Armenia | 38.3 /100 | #188 | Fair $46,094 |
| Spaniards | 37.2 /100 | #189 | Fair $46,059 |
| French Canadians | 36.1 /100 | #190 | Fair $46,026 |
| Finns | 33.4 /100 | #191 | Fair $45,940 |
| Germans | 33.2 /100 | #192 | Fair $45,935 |
| Guamanians/Chamorros | 33.2 /100 | #193 | Fair $45,933 |
| Immigrants | Costa Rica | 33.0 /100 | #194 | Fair $45,928 |
Demographics Similar to Bermudans by Median Earnings
In terms of median earnings, the demographic groups most similar to Bermudans are Panamanian ($45,593, a difference of 0.0%), Immigrants from Bosnia and Herzegovina ($45,600, a difference of 0.010%), Immigrants from Thailand ($45,598, a difference of 0.010%), Immigrants from Grenada ($45,596, a difference of 0.010%), and Immigrants from Senegal ($45,611, a difference of 0.040%).
| Demographics | Rating | Rank | Median Earnings |
| Tongans | 25.4 /100 | #205 | Fair $45,665 |
| Immigrants | Ghana | 24.8 /100 | #206 | Fair $45,641 |
| Immigrants | Senegal | 24.0 /100 | #207 | Fair $45,611 |
| Immigrants | Bosnia and Herzegovina | 23.7 /100 | #208 | Fair $45,600 |
| Immigrants | Thailand | 23.7 /100 | #209 | Fair $45,598 |
| Immigrants | Grenada | 23.6 /100 | #210 | Fair $45,596 |
| Panamanians | 23.5 /100 | #211 | Fair $45,593 |
| Bermudans | 23.5 /100 | #212 | Fair $45,593 |
| Immigrants | Colombia | 22.4 /100 | #213 | Fair $45,550 |
| Nigerians | 22.0 /100 | #214 | Fair $45,532 |
| Immigrants | Bangladesh | 22.0 /100 | #215 | Fair $45,532 |
| Guyanese | 20.6 /100 | #216 | Fair $45,470 |
| Tlingit-Haida | 20.5 /100 | #217 | Fair $45,468 |
| Spanish | 19.7 /100 | #218 | Poor $45,432 |
| Dutch | 18.4 /100 | #219 | Poor $45,370 |