Immigrants from Senegal vs Nicaraguan Male Poverty
COMPARE
Immigrants from Senegal
Nicaraguan
Male Poverty
Male Poverty Comparison
Immigrants from Senegal
Nicaraguans
14.0%
MALE POVERTY
0.0/ 100
METRIC RATING
301st/ 347
METRIC RANK
12.6%
MALE POVERTY
0.6/ 100
METRIC RATING
232nd/ 347
METRIC RANK
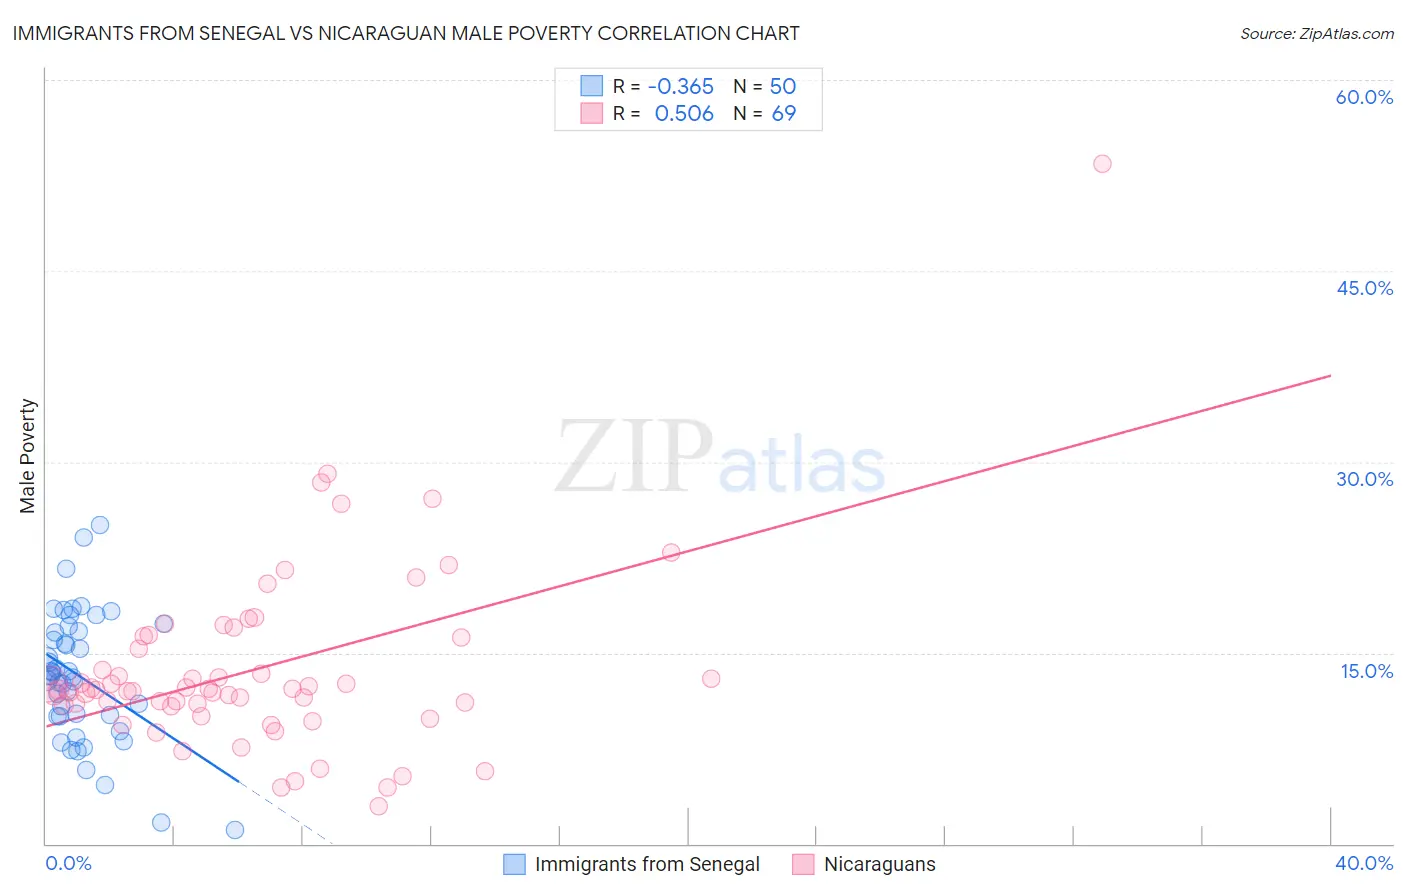
Immigrants from Senegal vs Nicaraguan Male Poverty Correlation Chart
The statistical analysis conducted on geographies consisting of 90,120,671 people shows a mild negative correlation between the proportion of Immigrants from Senegal and poverty level among males in the United States with a correlation coefficient (R) of -0.365 and weighted average of 14.0%. Similarly, the statistical analysis conducted on geographies consisting of 285,585,810 people shows a substantial positive correlation between the proportion of Nicaraguans and poverty level among males in the United States with a correlation coefficient (R) of 0.506 and weighted average of 12.6%, a difference of 11.6%.
Male Poverty Correlation Summary
| Measurement | Immigrants from Senegal | Nicaraguan |
| Minimum | 1.1% | 2.9% |
| Maximum | 25.1% | 53.4% |
| Range | 24.0% | 50.5% |
| Mean | 13.1% | 13.7% |
| Median | 13.2% | 12.1% |
| Interquartile 25% (IQ1) | 10.0% | 10.9% |
| Interquartile 75% (IQ3) | 16.7% | 16.3% |
| Interquartile Range (IQR) | 6.7% | 5.4% |
| Standard Deviation (Sample) | 5.1% | 7.3% |
| Standard Deviation (Population) | 5.0% | 7.3% |
Similar Demographics by Male Poverty
Demographics Similar to Immigrants from Senegal by Male Poverty
In terms of male poverty, the demographic groups most similar to Immigrants from Senegal are Immigrants from Caribbean (14.0%, a difference of 0.060%), Immigrants from Mexico (14.0%, a difference of 0.070%), Bahamian (14.1%, a difference of 0.10%), Immigrants from Guatemala (14.0%, a difference of 0.18%), and Senegalese (14.1%, a difference of 0.20%).
| Demographics | Rating | Rank | Male Poverty |
| Hispanics or Latinos | 0.0 /100 | #294 | Tragic 13.9% |
| Immigrants | Central America | 0.0 /100 | #295 | Tragic 13.9% |
| Cajuns | 0.0 /100 | #296 | Tragic 13.9% |
| Inupiat | 0.0 /100 | #297 | Tragic 14.0% |
| Blackfeet | 0.0 /100 | #298 | Tragic 14.0% |
| Immigrants | Guatemala | 0.0 /100 | #299 | Tragic 14.0% |
| Immigrants | Mexico | 0.0 /100 | #300 | Tragic 14.0% |
| Immigrants | Senegal | 0.0 /100 | #301 | Tragic 14.0% |
| Immigrants | Caribbean | 0.0 /100 | #302 | Tragic 14.0% |
| Bahamians | 0.0 /100 | #303 | Tragic 14.1% |
| Senegalese | 0.0 /100 | #304 | Tragic 14.1% |
| Immigrants | Bangladesh | 0.0 /100 | #305 | Tragic 14.1% |
| Creek | 0.0 /100 | #306 | Tragic 14.1% |
| Dutch West Indians | 0.0 /100 | #307 | Tragic 14.2% |
| Africans | 0.0 /100 | #308 | Tragic 14.2% |
Demographics Similar to Nicaraguans by Male Poverty
In terms of male poverty, the demographic groups most similar to Nicaraguans are Fijian (12.6%, a difference of 0.050%), Immigrants from Armenia (12.6%, a difference of 0.11%), Salvadoran (12.6%, a difference of 0.12%), Immigrants from Laos (12.6%, a difference of 0.47%), and Marshallese (12.5%, a difference of 0.68%).
| Demographics | Rating | Rank | Male Poverty |
| Osage | 1.5 /100 | #225 | Tragic 12.3% |
| Nigerians | 1.4 /100 | #226 | Tragic 12.3% |
| Alaska Natives | 1.4 /100 | #227 | Tragic 12.4% |
| Alsatians | 1.3 /100 | #228 | Tragic 12.4% |
| Cubans | 1.3 /100 | #229 | Tragic 12.4% |
| Marshallese | 0.8 /100 | #230 | Tragic 12.5% |
| Salvadorans | 0.6 /100 | #231 | Tragic 12.6% |
| Nicaraguans | 0.6 /100 | #232 | Tragic 12.6% |
| Fijians | 0.6 /100 | #233 | Tragic 12.6% |
| Immigrants | Armenia | 0.6 /100 | #234 | Tragic 12.6% |
| Immigrants | Laos | 0.5 /100 | #235 | Tragic 12.6% |
| Immigrants | Saudi Arabia | 0.4 /100 | #236 | Tragic 12.7% |
| French American Indians | 0.4 /100 | #237 | Tragic 12.7% |
| Ecuadorians | 0.4 /100 | #238 | Tragic 12.7% |
| Ghanaians | 0.4 /100 | #239 | Tragic 12.7% |