Immigrants from Pakistan vs Delaware Receiving Food Stamps
COMPARE
Immigrants from Pakistan
Delaware
Receiving Food Stamps
Receiving Food Stamps Comparison
Immigrants from Pakistan
Delaware
10.4%
RECEIVING FOOD STAMPS
96.2/ 100
METRIC RATING
109th/ 347
METRIC RANK
12.2%
RECEIVING FOOD STAMPS
26.1/ 100
METRIC RATING
197th/ 347
METRIC RANK
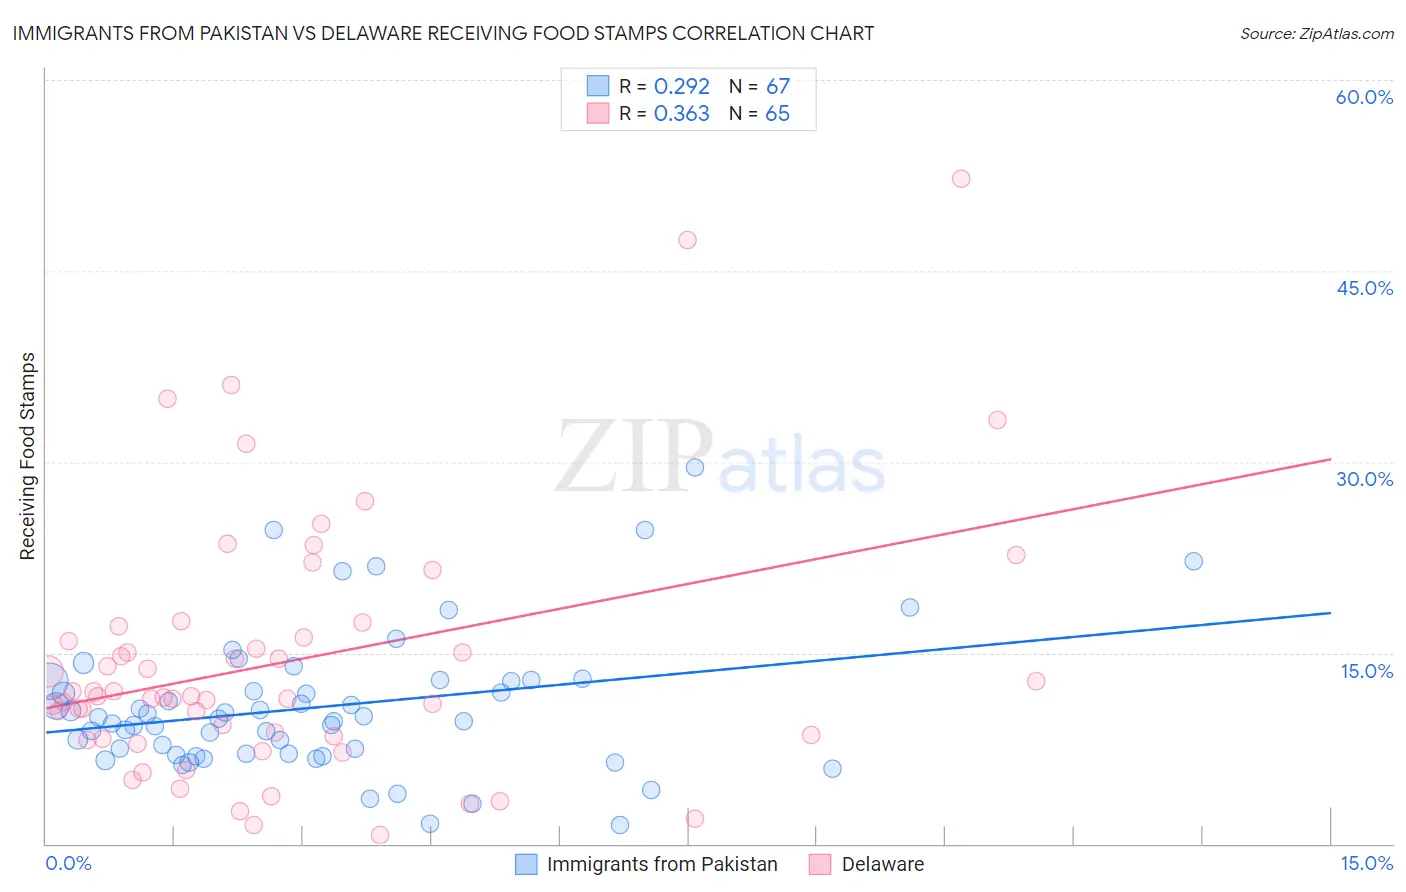
Immigrants from Pakistan vs Delaware Receiving Food Stamps Correlation Chart
The statistical analysis conducted on geographies consisting of 283,345,701 people shows a weak positive correlation between the proportion of Immigrants from Pakistan and percentage of population receiving government assistance and/or food stamps in the United States with a correlation coefficient (R) of 0.292 and weighted average of 10.4%. Similarly, the statistical analysis conducted on geographies consisting of 96,117,712 people shows a mild positive correlation between the proportion of Delaware and percentage of population receiving government assistance and/or food stamps in the United States with a correlation coefficient (R) of 0.363 and weighted average of 12.2%, a difference of 16.9%.
Receiving Food Stamps Correlation Summary
| Measurement | Immigrants from Pakistan | Delaware |
| Minimum | 1.5% | 0.70% |
| Maximum | 29.6% | 52.2% |
| Range | 28.1% | 51.5% |
| Mean | 10.8% | 14.3% |
| Median | 9.8% | 11.6% |
| Interquartile 25% (IQ1) | 7.1% | 8.4% |
| Interquartile 75% (IQ3) | 12.8% | 16.7% |
| Interquartile Range (IQR) | 5.7% | 8.3% |
| Standard Deviation (Sample) | 5.5% | 10.1% |
| Standard Deviation (Population) | 5.4% | 10.1% |
Similar Demographics by Receiving Food Stamps
Demographics Similar to Immigrants from Pakistan by Receiving Food Stamps
In terms of receiving food stamps, the demographic groups most similar to Immigrants from Pakistan are Carpatho Rusyn (10.4%, a difference of 0.040%), Korean (10.4%, a difference of 0.080%), Immigrants from Italy (10.4%, a difference of 0.23%), Pakistani (10.4%, a difference of 0.28%), and Immigrants from Malaysia (10.4%, a difference of 0.32%).
| Demographics | Rating | Rank | Receiving Food Stamps |
| Immigrants | Europe | 96.8 /100 | #102 | Exceptional 10.3% |
| Immigrants | Latvia | 96.8 /100 | #103 | Exceptional 10.3% |
| Immigrants | Hungary | 96.7 /100 | #104 | Exceptional 10.3% |
| Immigrants | Malaysia | 96.5 /100 | #105 | Exceptional 10.4% |
| Immigrants | Italy | 96.4 /100 | #106 | Exceptional 10.4% |
| Koreans | 96.3 /100 | #107 | Exceptional 10.4% |
| Carpatho Rusyns | 96.2 /100 | #108 | Exceptional 10.4% |
| Immigrants | Pakistan | 96.2 /100 | #109 | Exceptional 10.4% |
| Pakistanis | 95.9 /100 | #110 | Exceptional 10.4% |
| Romanians | 95.8 /100 | #111 | Exceptional 10.4% |
| Mongolians | 95.8 /100 | #112 | Exceptional 10.5% |
| Icelanders | 95.4 /100 | #113 | Exceptional 10.5% |
| Scotch-Irish | 95.1 /100 | #114 | Exceptional 10.5% |
| Immigrants | Saudi Arabia | 94.9 /100 | #115 | Exceptional 10.5% |
| Canadians | 94.8 /100 | #116 | Exceptional 10.5% |
Demographics Similar to Delaware by Receiving Food Stamps
In terms of receiving food stamps, the demographic groups most similar to Delaware are Iraqi (12.2%, a difference of 0.080%), American (12.2%, a difference of 0.11%), Immigrants from Costa Rica (12.2%, a difference of 0.13%), Immigrants from Sudan (12.1%, a difference of 0.17%), and Portuguese (12.2%, a difference of 0.18%).
| Demographics | Rating | Rank | Receiving Food Stamps |
| Immigrants | Peru | 32.2 /100 | #190 | Fair 12.0% |
| Venezuelans | 32.1 /100 | #191 | Fair 12.0% |
| Samoans | 31.0 /100 | #192 | Fair 12.1% |
| Immigrants | Fiji | 27.8 /100 | #193 | Fair 12.1% |
| Immigrants | Sudan | 27.1 /100 | #194 | Fair 12.1% |
| Americans | 26.7 /100 | #195 | Fair 12.2% |
| Iraqis | 26.6 /100 | #196 | Fair 12.2% |
| Delaware | 26.1 /100 | #197 | Fair 12.2% |
| Immigrants | Costa Rica | 25.4 /100 | #198 | Fair 12.2% |
| Portuguese | 25.1 /100 | #199 | Fair 12.2% |
| Sierra Leoneans | 23.6 /100 | #200 | Fair 12.2% |
| Ugandans | 22.5 /100 | #201 | Fair 12.2% |
| Immigrants | Venezuela | 20.1 /100 | #202 | Fair 12.3% |
| Shoshone | 17.7 /100 | #203 | Poor 12.4% |
| Immigrants | Nonimmigrants | 17.6 /100 | #204 | Poor 12.4% |