Immigrants from Italy vs Bhutanese Wage/Income Gap
COMPARE
Immigrants from Italy
Bhutanese
Wage/Income Gap
Wage/Income Gap Comparison
Immigrants from Italy
Bhutanese
26.5%
WAGE/INCOME GAP
15.8/ 100
METRIC RATING
207th/ 347
METRIC RANK
27.0%
WAGE/INCOME GAP
5.3/ 100
METRIC RATING
231st/ 347
METRIC RANK
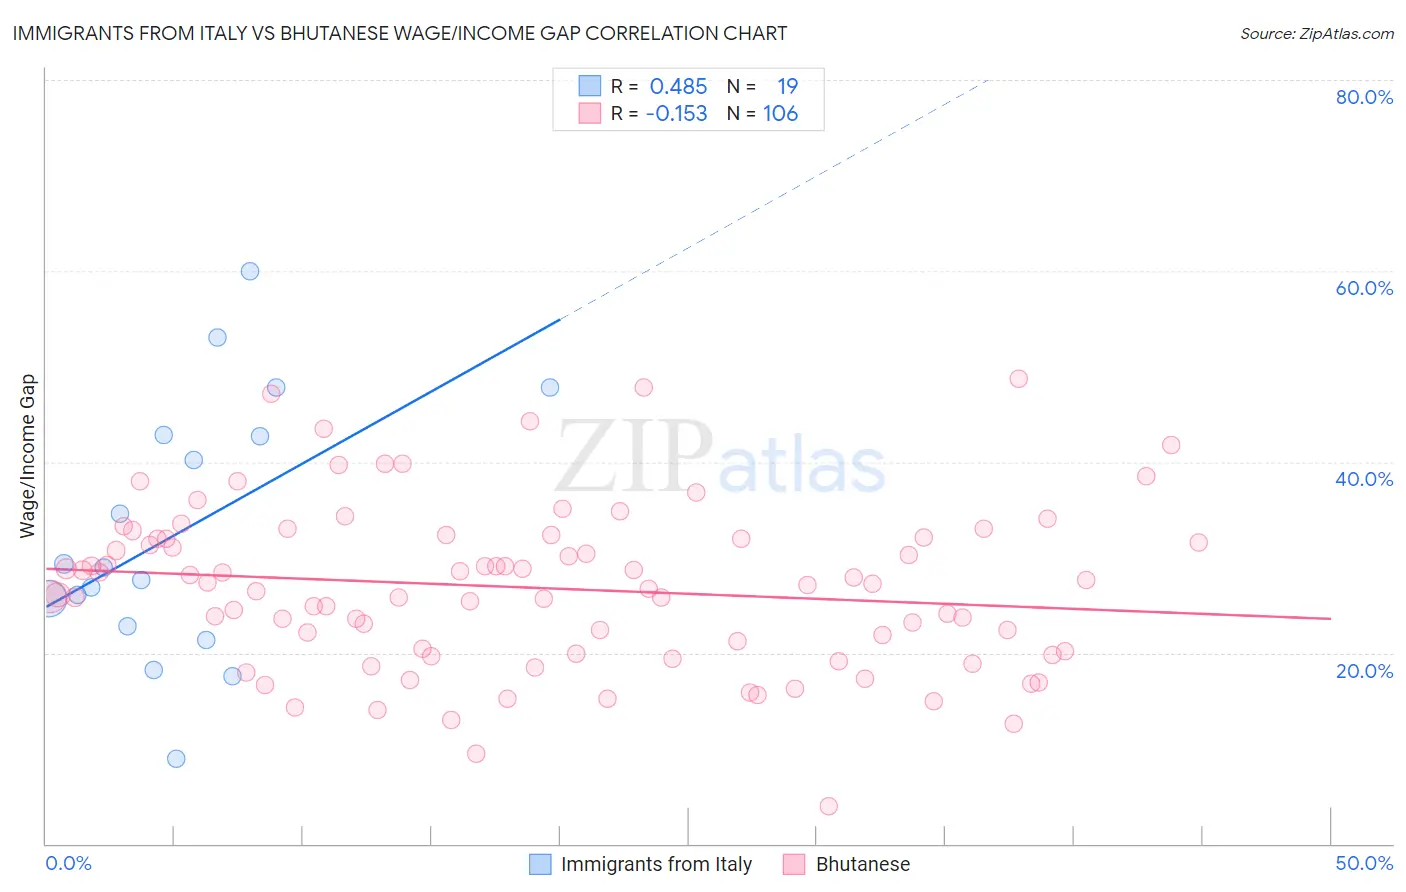
Immigrants from Italy vs Bhutanese Wage/Income Gap Correlation Chart
The statistical analysis conducted on geographies consisting of 324,019,244 people shows a moderate positive correlation between the proportion of Immigrants from Italy and wage/income gap percentage in the United States with a correlation coefficient (R) of 0.485 and weighted average of 26.5%. Similarly, the statistical analysis conducted on geographies consisting of 455,138,655 people shows a poor negative correlation between the proportion of Bhutanese and wage/income gap percentage in the United States with a correlation coefficient (R) of -0.153 and weighted average of 27.0%, a difference of 1.9%.
Wage/Income Gap Correlation Summary
| Measurement | Immigrants from Italy | Bhutanese |
| Minimum | 8.9% | 3.9% |
| Maximum | 60.0% | 48.8% |
| Range | 51.1% | 44.9% |
| Mean | 32.7% | 26.8% |
| Median | 28.9% | 27.2% |
| Interquartile 25% (IQ1) | 22.8% | 20.1% |
| Interquartile 75% (IQ3) | 42.8% | 32.0% |
| Interquartile Range (IQR) | 19.9% | 11.9% |
| Standard Deviation (Sample) | 13.5% | 8.5% |
| Standard Deviation (Population) | 13.2% | 8.5% |
Similar Demographics by Wage/Income Gap
Demographics Similar to Immigrants from Italy by Wage/Income Gap
In terms of wage/income gap, the demographic groups most similar to Immigrants from Italy are Indian (Asian) (26.4%, a difference of 0.080%), Immigrants from Southern Europe (26.4%, a difference of 0.17%), Immigrants from Russia (26.4%, a difference of 0.35%), Laotian (26.4%, a difference of 0.37%), and Immigrants from Eastern Europe (26.4%, a difference of 0.37%).
| Demographics | Rating | Rank | Wage/Income Gap |
| Delaware | 20.9 /100 | #200 | Fair 26.3% |
| Immigrants | Syria | 19.3 /100 | #201 | Poor 26.4% |
| Laotians | 19.2 /100 | #202 | Poor 26.4% |
| Immigrants | Eastern Europe | 19.2 /100 | #203 | Poor 26.4% |
| Immigrants | Russia | 19.0 /100 | #204 | Poor 26.4% |
| Immigrants | Southern Europe | 17.3 /100 | #205 | Poor 26.4% |
| Indians (Asian) | 16.5 /100 | #206 | Poor 26.4% |
| Immigrants | Italy | 15.8 /100 | #207 | Poor 26.5% |
| Egyptians | 12.7 /100 | #208 | Poor 26.6% |
| Immigrants | Kuwait | 12.6 /100 | #209 | Poor 26.6% |
| Arabs | 12.3 /100 | #210 | Poor 26.6% |
| Mongolians | 11.4 /100 | #211 | Poor 26.6% |
| Iraqis | 11.2 /100 | #212 | Poor 26.6% |
| Immigrants | Iraq | 10.3 /100 | #213 | Poor 26.7% |
| Immigrants | China | 10.3 /100 | #214 | Poor 26.7% |
Demographics Similar to Bhutanese by Wage/Income Gap
In terms of wage/income gap, the demographic groups most similar to Bhutanese are Argentinean (27.0%, a difference of 0.020%), Ottawa (27.0%, a difference of 0.030%), Immigrants from Asia (27.0%, a difference of 0.070%), Immigrants from Brazil (27.0%, a difference of 0.080%), and Spaniard (27.0%, a difference of 0.11%).
| Demographics | Rating | Rank | Wage/Income Gap |
| Immigrants | Argentina | 7.2 /100 | #224 | Tragic 26.8% |
| Immigrants | Ireland | 6.5 /100 | #225 | Tragic 26.9% |
| Asians | 5.9 /100 | #226 | Tragic 26.9% |
| Spaniards | 5.6 /100 | #227 | Tragic 27.0% |
| Immigrants | Turkey | 5.6 /100 | #228 | Tragic 27.0% |
| Immigrants | Asia | 5.5 /100 | #229 | Tragic 27.0% |
| Ottawa | 5.3 /100 | #230 | Tragic 27.0% |
| Bhutanese | 5.3 /100 | #231 | Tragic 27.0% |
| Argentineans | 5.2 /100 | #232 | Tragic 27.0% |
| Immigrants | Brazil | 5.0 /100 | #233 | Tragic 27.0% |
| Immigrants | Pakistan | 4.9 /100 | #234 | Tragic 27.0% |
| Immigrants | Hungary | 4.8 /100 | #235 | Tragic 27.0% |
| Immigrants | Romania | 4.8 /100 | #236 | Tragic 27.0% |
| Immigrants | Eastern Asia | 4.4 /100 | #237 | Tragic 27.1% |
| Osage | 4.4 /100 | #238 | Tragic 27.1% |