Senegalese vs Bhutanese Wage/Income Gap
COMPARE
Senegalese
Bhutanese
Wage/Income Gap
Wage/Income Gap Comparison
Senegalese
Bhutanese
20.7%
WAGE/INCOME GAP
100.0/ 100
METRIC RATING
25th/ 347
METRIC RANK
27.0%
WAGE/INCOME GAP
5.3/ 100
METRIC RATING
231st/ 347
METRIC RANK
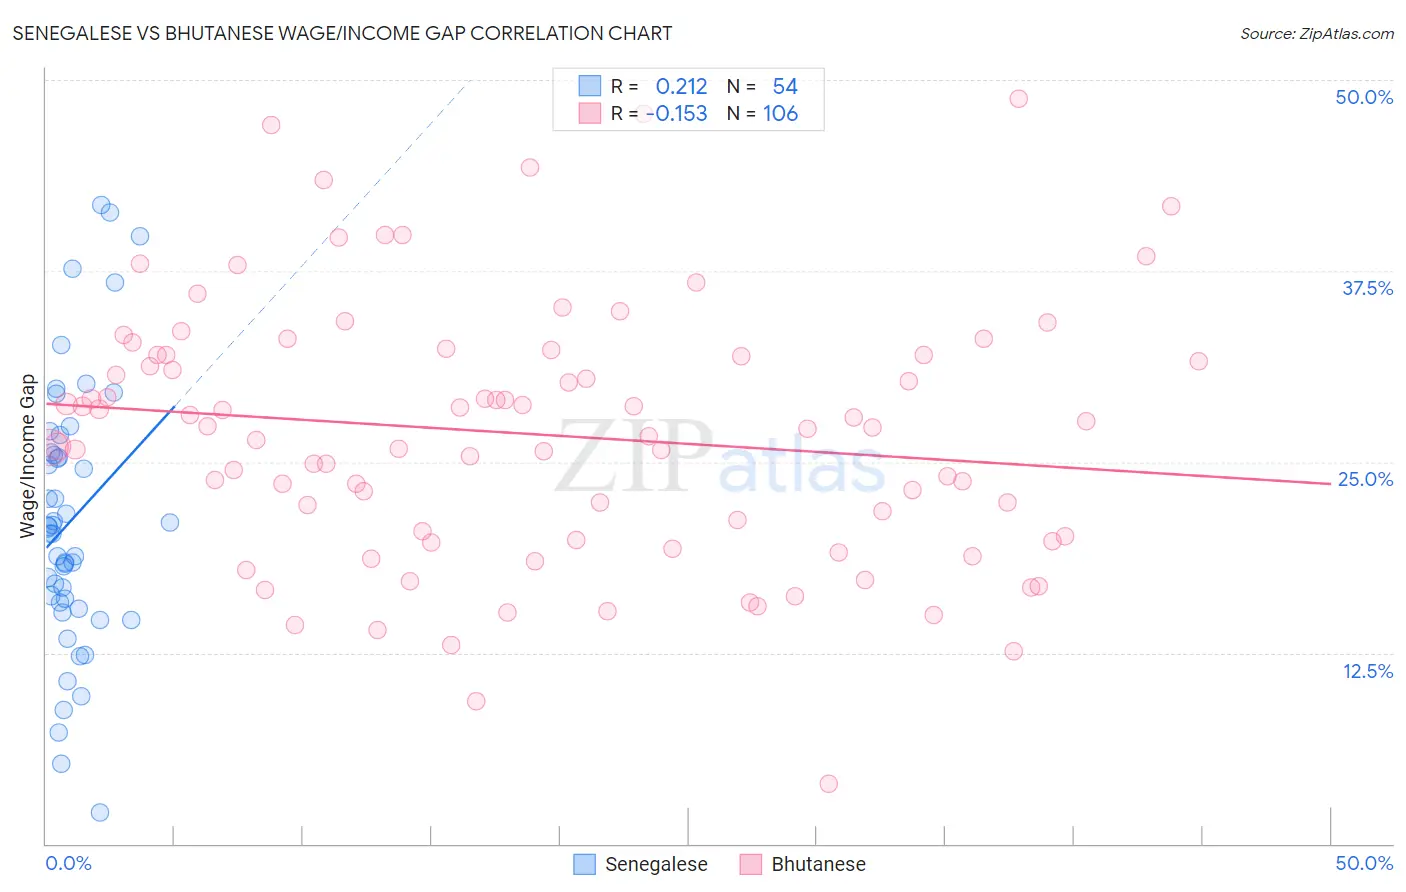
Senegalese vs Bhutanese Wage/Income Gap Correlation Chart
The statistical analysis conducted on geographies consisting of 78,133,613 people shows a weak positive correlation between the proportion of Senegalese and wage/income gap percentage in the United States with a correlation coefficient (R) of 0.212 and weighted average of 20.7%. Similarly, the statistical analysis conducted on geographies consisting of 455,138,655 people shows a poor negative correlation between the proportion of Bhutanese and wage/income gap percentage in the United States with a correlation coefficient (R) of -0.153 and weighted average of 27.0%, a difference of 30.6%.
Wage/Income Gap Correlation Summary
| Measurement | Senegalese | Bhutanese |
| Minimum | 2.0% | 3.9% |
| Maximum | 41.8% | 48.8% |
| Range | 39.7% | 44.9% |
| Mean | 21.2% | 26.8% |
| Median | 20.5% | 27.2% |
| Interquartile 25% (IQ1) | 15.8% | 20.1% |
| Interquartile 75% (IQ3) | 25.6% | 32.0% |
| Interquartile Range (IQR) | 9.8% | 11.9% |
| Standard Deviation (Sample) | 8.8% | 8.5% |
| Standard Deviation (Population) | 8.7% | 8.5% |
Similar Demographics by Wage/Income Gap
Demographics Similar to Senegalese by Wage/Income Gap
In terms of wage/income gap, the demographic groups most similar to Senegalese are Pueblo (20.7%, a difference of 0.11%), Dominican (20.6%, a difference of 0.30%), Immigrants from Armenia (20.7%, a difference of 0.31%), Immigrants from Dominican Republic (20.6%, a difference of 0.47%), and Immigrants from Liberia (20.6%, a difference of 0.49%).
| Demographics | Rating | Rank | Wage/Income Gap |
| Hopi | 100.0 /100 | #18 | Exceptional 20.0% |
| Immigrants | Dominica | 100.0 /100 | #19 | Exceptional 20.0% |
| Bahamians | 100.0 /100 | #20 | Exceptional 20.2% |
| Immigrants | Caribbean | 100.0 /100 | #21 | Exceptional 20.4% |
| Immigrants | Liberia | 100.0 /100 | #22 | Exceptional 20.6% |
| Immigrants | Dominican Republic | 100.0 /100 | #23 | Exceptional 20.6% |
| Dominicans | 100.0 /100 | #24 | Exceptional 20.6% |
| Senegalese | 100.0 /100 | #25 | Exceptional 20.7% |
| Pueblo | 100.0 /100 | #26 | Exceptional 20.7% |
| Immigrants | Armenia | 100.0 /100 | #27 | Exceptional 20.7% |
| Inupiat | 100.0 /100 | #28 | Exceptional 20.8% |
| Immigrants | Senegal | 100.0 /100 | #29 | Exceptional 20.9% |
| Immigrants | Bangladesh | 100.0 /100 | #30 | Exceptional 20.9% |
| Vietnamese | 100.0 /100 | #31 | Exceptional 21.0% |
| Immigrants | Yemen | 100.0 /100 | #32 | Exceptional 21.1% |
Demographics Similar to Bhutanese by Wage/Income Gap
In terms of wage/income gap, the demographic groups most similar to Bhutanese are Argentinean (27.0%, a difference of 0.020%), Ottawa (27.0%, a difference of 0.030%), Immigrants from Asia (27.0%, a difference of 0.070%), Immigrants from Brazil (27.0%, a difference of 0.080%), and Spaniard (27.0%, a difference of 0.11%).
| Demographics | Rating | Rank | Wage/Income Gap |
| Immigrants | Argentina | 7.2 /100 | #224 | Tragic 26.8% |
| Immigrants | Ireland | 6.5 /100 | #225 | Tragic 26.9% |
| Asians | 5.9 /100 | #226 | Tragic 26.9% |
| Spaniards | 5.6 /100 | #227 | Tragic 27.0% |
| Immigrants | Turkey | 5.6 /100 | #228 | Tragic 27.0% |
| Immigrants | Asia | 5.5 /100 | #229 | Tragic 27.0% |
| Ottawa | 5.3 /100 | #230 | Tragic 27.0% |
| Bhutanese | 5.3 /100 | #231 | Tragic 27.0% |
| Argentineans | 5.2 /100 | #232 | Tragic 27.0% |
| Immigrants | Brazil | 5.0 /100 | #233 | Tragic 27.0% |
| Immigrants | Pakistan | 4.9 /100 | #234 | Tragic 27.0% |
| Immigrants | Hungary | 4.8 /100 | #235 | Tragic 27.0% |
| Immigrants | Romania | 4.8 /100 | #236 | Tragic 27.0% |
| Immigrants | Eastern Asia | 4.4 /100 | #237 | Tragic 27.1% |
| Osage | 4.4 /100 | #238 | Tragic 27.1% |