Immigrants from Italy vs Bhutanese Female Unemployment
COMPARE
Immigrants from Italy
Bhutanese
Female Unemployment
Female Unemployment Comparison
Immigrants from Italy
Bhutanese
5.2%
FEMALE UNEMPLOYMENT
75.0/ 100
METRIC RATING
152nd/ 347
METRIC RANK
4.9%
FEMALE UNEMPLOYMENT
98.7/ 100
METRIC RATING
59th/ 347
METRIC RANK
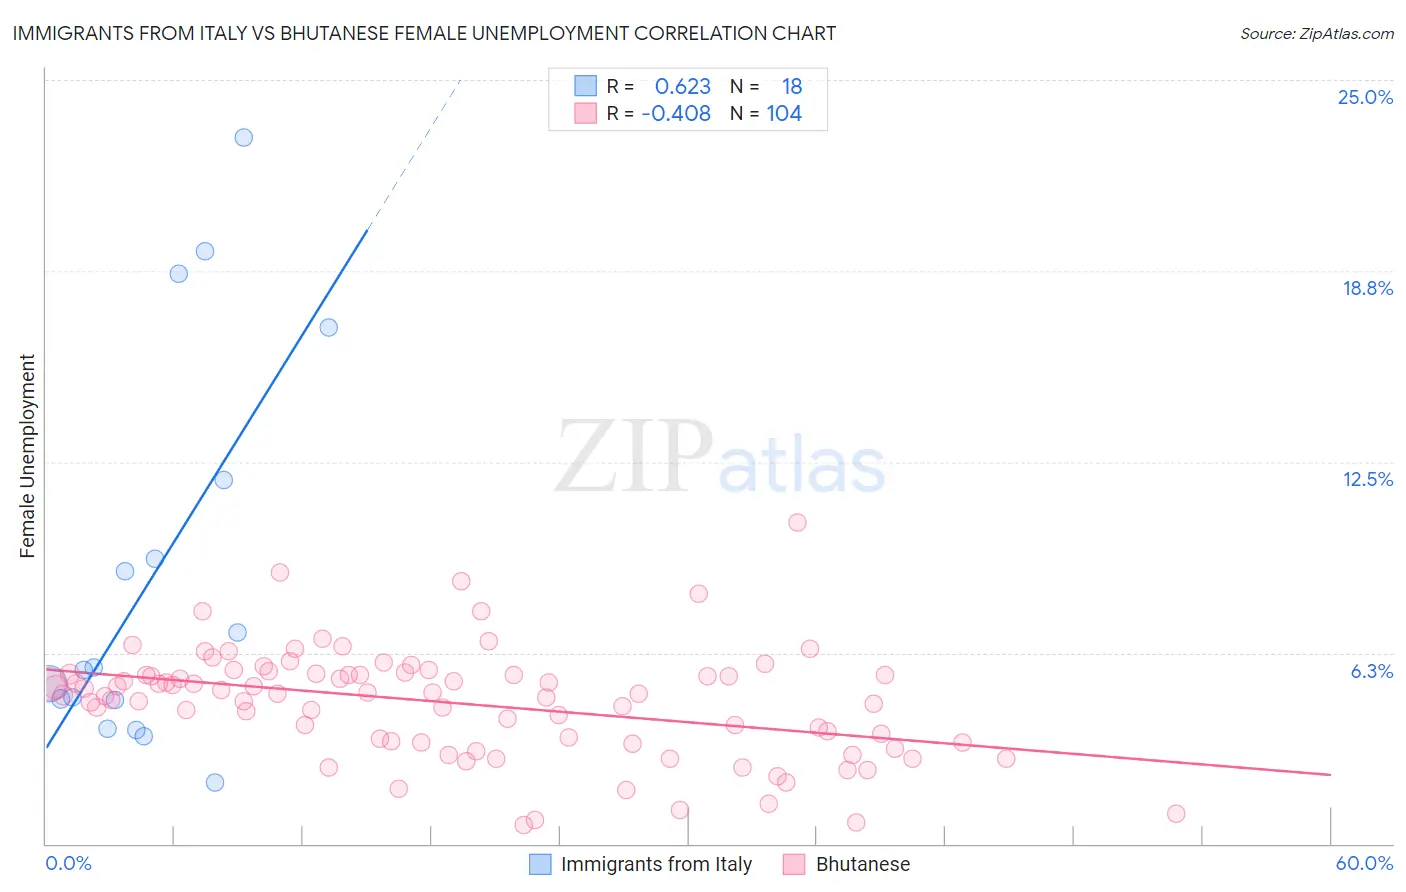
Immigrants from Italy vs Bhutanese Female Unemployment Correlation Chart
The statistical analysis conducted on geographies consisting of 323,110,337 people shows a significant positive correlation between the proportion of Immigrants from Italy and unemploymnet rate among females in the United States with a correlation coefficient (R) of 0.623 and weighted average of 5.2%. Similarly, the statistical analysis conducted on geographies consisting of 452,429,173 people shows a moderate negative correlation between the proportion of Bhutanese and unemploymnet rate among females in the United States with a correlation coefficient (R) of -0.408 and weighted average of 4.9%, a difference of 5.1%.
Female Unemployment Correlation Summary
| Measurement | Immigrants from Italy | Bhutanese |
| Minimum | 2.0% | 0.60% |
| Maximum | 23.1% | 10.5% |
| Range | 21.1% | 9.9% |
| Mean | 8.8% | 4.6% |
| Median | 5.7% | 4.9% |
| Interquartile 25% (IQ1) | 4.7% | 3.3% |
| Interquartile 75% (IQ3) | 11.9% | 5.5% |
| Interquartile Range (IQR) | 7.2% | 2.2% |
| Standard Deviation (Sample) | 6.4% | 1.8% |
| Standard Deviation (Population) | 6.2% | 1.8% |
Similar Demographics by Female Unemployment
Demographics Similar to Immigrants from Italy by Female Unemployment
In terms of female unemployment, the demographic groups most similar to Immigrants from Italy are Immigrants from Greece (5.2%, a difference of 0.010%), Immigrants from China (5.2%, a difference of 0.080%), Egyptian (5.2%, a difference of 0.28%), Asian (5.2%, a difference of 0.29%), and Immigrants from Argentina (5.2%, a difference of 0.32%).
| Demographics | Rating | Rank | Female Unemployment |
| Immigrants | Oceania | 79.5 /100 | #145 | Good 5.2% |
| Immigrants | Norway | 79.4 /100 | #146 | Good 5.2% |
| Argentineans | 79.2 /100 | #147 | Good 5.2% |
| Immigrants | Argentina | 78.7 /100 | #148 | Good 5.2% |
| Asians | 78.3 /100 | #149 | Good 5.2% |
| Egyptians | 78.3 /100 | #150 | Good 5.2% |
| Immigrants | China | 75.9 /100 | #151 | Good 5.2% |
| Immigrants | Italy | 75.0 /100 | #152 | Good 5.2% |
| Immigrants | Greece | 74.9 /100 | #153 | Good 5.2% |
| South Africans | 70.8 /100 | #154 | Good 5.2% |
| Immigrants | Egypt | 70.0 /100 | #155 | Good 5.2% |
| Immigrants | Northern Africa | 69.6 /100 | #156 | Good 5.2% |
| Immigrants | Russia | 69.3 /100 | #157 | Good 5.2% |
| Albanians | 68.3 /100 | #158 | Good 5.2% |
| Immigrants | Micronesia | 66.9 /100 | #159 | Good 5.2% |
Demographics Similar to Bhutanese by Female Unemployment
In terms of female unemployment, the demographic groups most similar to Bhutanese are Immigrants from Scotland (4.9%, a difference of 0.080%), Immigrants from Canada (4.9%, a difference of 0.090%), Immigrants from Nepal (4.9%, a difference of 0.090%), Immigrants from Lithuania (4.9%, a difference of 0.12%), and Immigrants from Belgium (4.9%, a difference of 0.20%).
| Demographics | Rating | Rank | Female Unemployment |
| Slavs | 99.1 /100 | #52 | Exceptional 4.9% |
| Whites/Caucasians | 99.0 /100 | #53 | Exceptional 4.9% |
| Immigrants | Zimbabwe | 99.0 /100 | #54 | Exceptional 4.9% |
| Immigrants | Moldova | 99.0 /100 | #55 | Exceptional 4.9% |
| Serbians | 99.0 /100 | #56 | Exceptional 4.9% |
| Icelanders | 98.8 /100 | #57 | Exceptional 4.9% |
| Immigrants | Lithuania | 98.8 /100 | #58 | Exceptional 4.9% |
| Bhutanese | 98.7 /100 | #59 | Exceptional 4.9% |
| Immigrants | Scotland | 98.6 /100 | #60 | Exceptional 4.9% |
| Immigrants | Canada | 98.6 /100 | #61 | Exceptional 4.9% |
| Immigrants | Nepal | 98.6 /100 | #62 | Exceptional 4.9% |
| Immigrants | Belgium | 98.5 /100 | #63 | Exceptional 4.9% |
| Celtics | 98.5 /100 | #64 | Exceptional 4.9% |
| Immigrants | North America | 98.3 /100 | #65 | Exceptional 4.9% |
| Hungarians | 98.3 /100 | #66 | Exceptional 4.9% |