Immigrants from Denmark vs Mexican Wage/Income Gap
COMPARE
Immigrants from Denmark
Mexican
Wage/Income Gap
Wage/Income Gap Comparison
Immigrants from Denmark
Mexicans
28.5%
WAGE/INCOME GAP
0.1/ 100
METRIC RATING
307th/ 347
METRIC RANK
26.0%
WAGE/INCOME GAP
34.4/ 100
METRIC RATING
184th/ 347
METRIC RANK
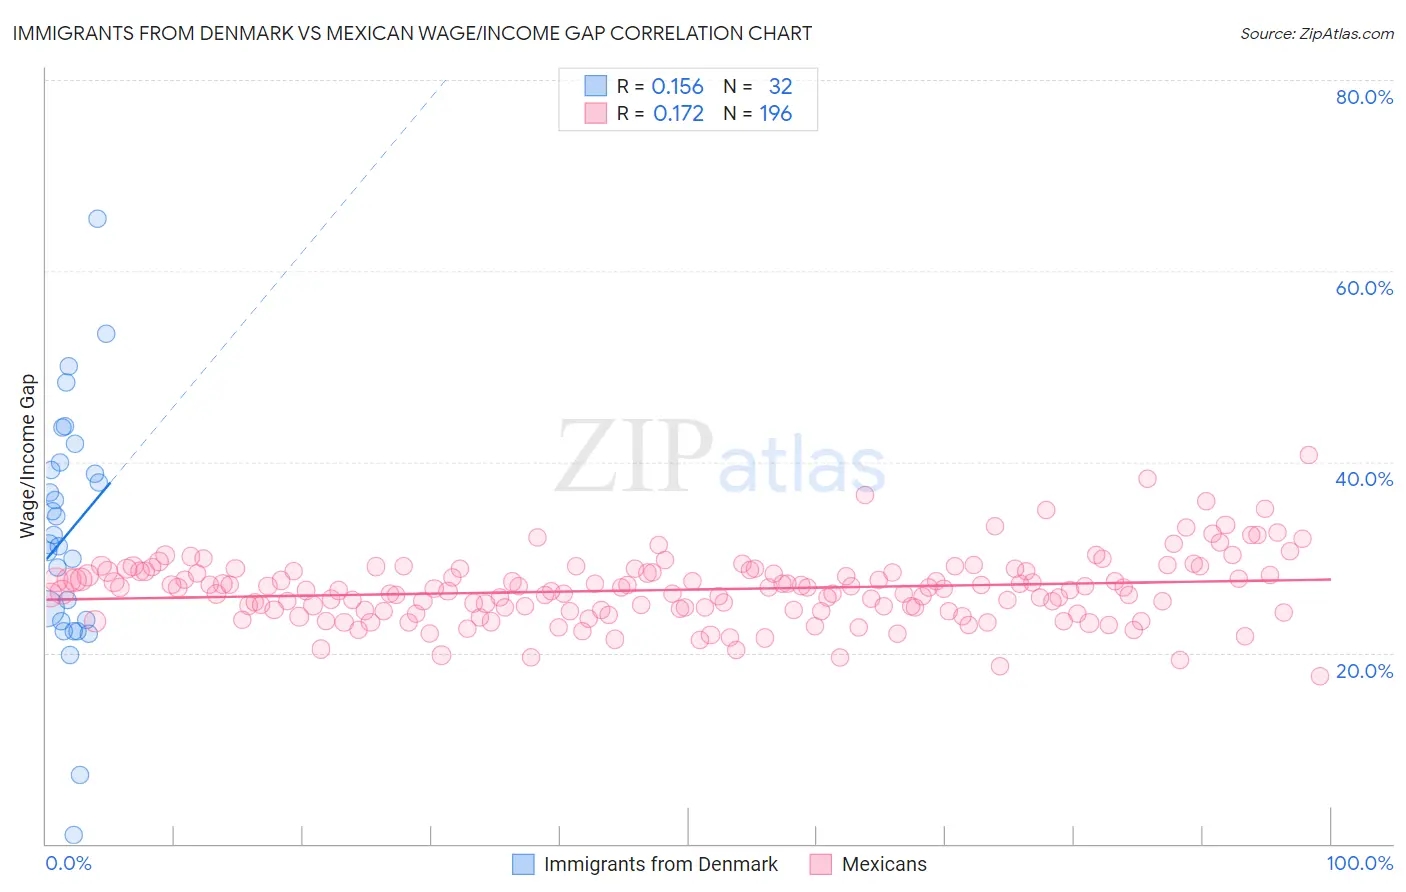
Immigrants from Denmark vs Mexican Wage/Income Gap Correlation Chart
The statistical analysis conducted on geographies consisting of 136,393,196 people shows a poor positive correlation between the proportion of Immigrants from Denmark and wage/income gap percentage in the United States with a correlation coefficient (R) of 0.156 and weighted average of 28.5%. Similarly, the statistical analysis conducted on geographies consisting of 562,615,908 people shows a poor positive correlation between the proportion of Mexicans and wage/income gap percentage in the United States with a correlation coefficient (R) of 0.172 and weighted average of 26.0%, a difference of 9.5%.
Wage/Income Gap Correlation Summary
| Measurement | Immigrants from Denmark | Mexican |
| Minimum | 0.92% | 17.6% |
| Maximum | 65.5% | 40.8% |
| Range | 64.6% | 23.2% |
| Mean | 32.6% | 26.6% |
| Median | 31.9% | 26.6% |
| Interquartile 25% (IQ1) | 23.4% | 24.5% |
| Interquartile 75% (IQ3) | 39.5% | 28.5% |
| Interquartile Range (IQR) | 16.2% | 4.1% |
| Standard Deviation (Sample) | 12.9% | 3.5% |
| Standard Deviation (Population) | 12.7% | 3.5% |
Similar Demographics by Wage/Income Gap
Demographics Similar to Immigrants from Denmark by Wage/Income Gap
In terms of wage/income gap, the demographic groups most similar to Immigrants from Denmark are White/Caucasian (28.5%, a difference of 0.010%), Immigrants from South Africa (28.5%, a difference of 0.050%), Immigrants from Netherlands (28.5%, a difference of 0.070%), Polish (28.5%, a difference of 0.070%), and Scotch-Irish (28.5%, a difference of 0.15%).
| Demographics | Rating | Rank | Wage/Income Gap |
| Immigrants | Northern Europe | 0.2 /100 | #300 | Tragic 28.5% |
| Immigrants | Canada | 0.2 /100 | #301 | Tragic 28.5% |
| Scotch-Irish | 0.2 /100 | #302 | Tragic 28.5% |
| Irish | 0.2 /100 | #303 | Tragic 28.5% |
| Immigrants | Netherlands | 0.2 /100 | #304 | Tragic 28.5% |
| Immigrants | South Africa | 0.1 /100 | #305 | Tragic 28.5% |
| Whites/Caucasians | 0.1 /100 | #306 | Tragic 28.5% |
| Immigrants | Denmark | 0.1 /100 | #307 | Tragic 28.5% |
| Poles | 0.1 /100 | #308 | Tragic 28.5% |
| Macedonians | 0.1 /100 | #309 | Tragic 28.6% |
| Finns | 0.1 /100 | #310 | Tragic 28.6% |
| Immigrants | Lithuania | 0.1 /100 | #311 | Tragic 28.6% |
| Eastern Europeans | 0.1 /100 | #312 | Tragic 28.6% |
| French | 0.1 /100 | #313 | Tragic 28.7% |
| Immigrants | Scotland | 0.1 /100 | #314 | Tragic 28.7% |
Demographics Similar to Mexicans by Wage/Income Gap
In terms of wage/income gap, the demographic groups most similar to Mexicans are Pakistani (26.1%, a difference of 0.050%), Immigrants from Kazakhstan (26.0%, a difference of 0.060%), Immigrants from Serbia (26.0%, a difference of 0.070%), Immigrants from Indonesia (26.1%, a difference of 0.13%), and Immigrants from Bolivia (26.0%, a difference of 0.14%).
| Demographics | Rating | Rank | Wage/Income Gap |
| Cambodians | 45.1 /100 | #177 | Average 25.8% |
| Chinese | 42.0 /100 | #178 | Average 25.9% |
| Samoans | 38.6 /100 | #179 | Fair 26.0% |
| Guamanians/Chamorros | 38.0 /100 | #180 | Fair 26.0% |
| Immigrants | Bolivia | 36.4 /100 | #181 | Fair 26.0% |
| Immigrants | Serbia | 35.4 /100 | #182 | Fair 26.0% |
| Immigrants | Kazakhstan | 35.2 /100 | #183 | Fair 26.0% |
| Mexicans | 34.4 /100 | #184 | Fair 26.0% |
| Pakistanis | 33.7 /100 | #185 | Fair 26.1% |
| Immigrants | Indonesia | 32.5 /100 | #186 | Fair 26.1% |
| Palestinians | 29.9 /100 | #187 | Fair 26.1% |
| Immigrants | Egypt | 29.9 /100 | #188 | Fair 26.1% |
| Immigrants | Moldova | 26.6 /100 | #189 | Fair 26.2% |
| Immigrants | Croatia | 24.8 /100 | #190 | Fair 26.2% |
| Immigrants | Venezuela | 24.7 /100 | #191 | Fair 26.2% |