Immigrants from Denmark vs Immigrants from Laos Wage/Income Gap
COMPARE
Immigrants from Denmark
Immigrants from Laos
Wage/Income Gap
Wage/Income Gap Comparison
Immigrants from Denmark
Immigrants from Laos
28.5%
WAGE/INCOME GAP
0.1/ 100
METRIC RATING
307th/ 347
METRIC RANK
23.8%
WAGE/INCOME GAP
99.0/ 100
METRIC RATING
102nd/ 347
METRIC RANK
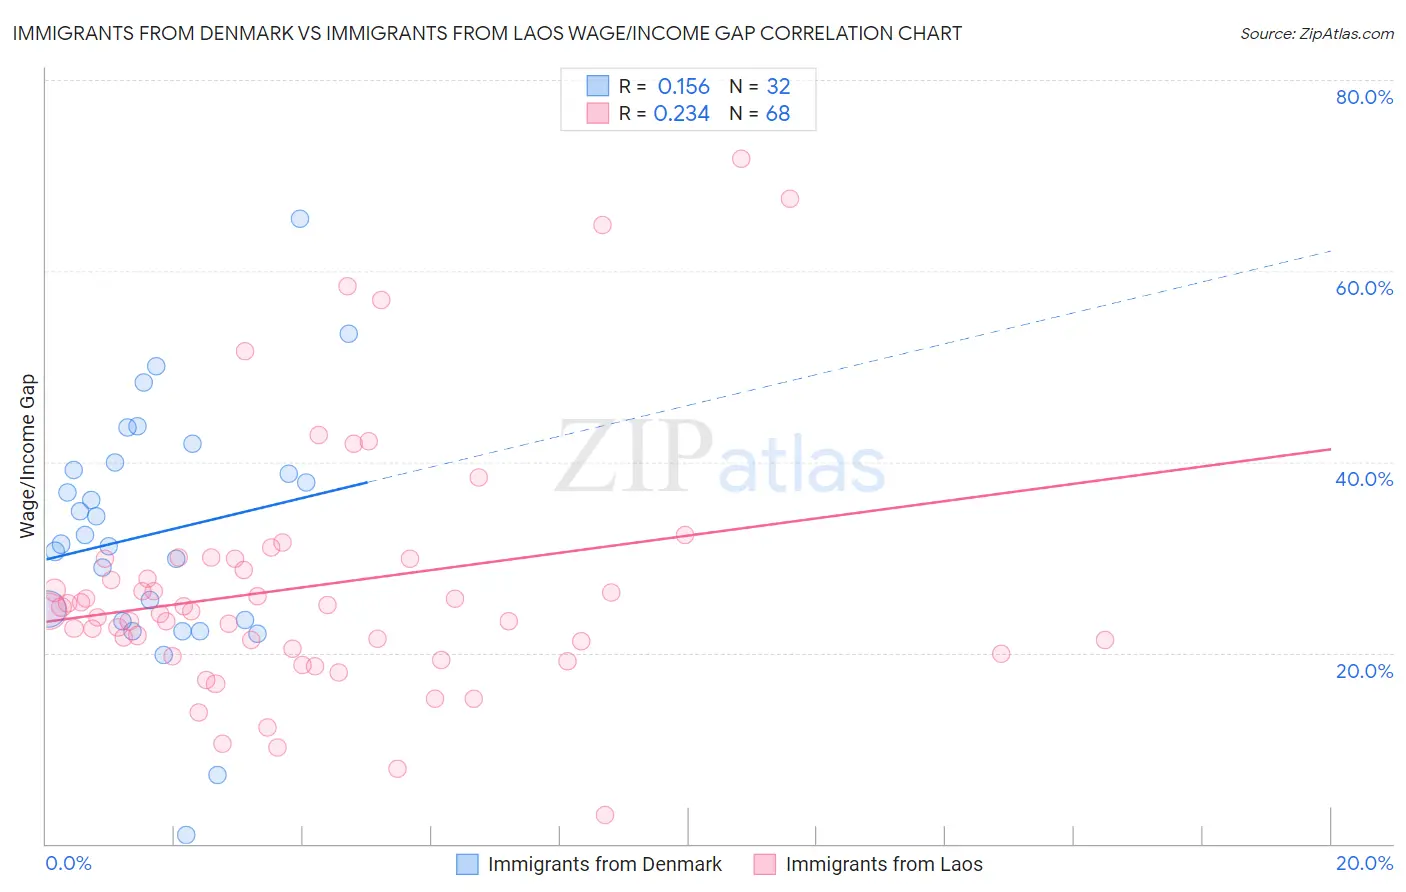
Immigrants from Denmark vs Immigrants from Laos Wage/Income Gap Correlation Chart
The statistical analysis conducted on geographies consisting of 136,393,196 people shows a poor positive correlation between the proportion of Immigrants from Denmark and wage/income gap percentage in the United States with a correlation coefficient (R) of 0.156 and weighted average of 28.5%. Similarly, the statistical analysis conducted on geographies consisting of 201,434,388 people shows a weak positive correlation between the proportion of Immigrants from Laos and wage/income gap percentage in the United States with a correlation coefficient (R) of 0.234 and weighted average of 23.8%, a difference of 19.7%.
Wage/Income Gap Correlation Summary
| Measurement | Immigrants from Denmark | Immigrants from Laos |
| Minimum | 0.92% | 3.0% |
| Maximum | 65.5% | 71.7% |
| Range | 64.6% | 68.7% |
| Mean | 32.6% | 27.0% |
| Median | 31.9% | 24.4% |
| Interquartile 25% (IQ1) | 23.4% | 20.2% |
| Interquartile 75% (IQ3) | 39.5% | 29.8% |
| Interquartile Range (IQR) | 16.2% | 9.7% |
| Standard Deviation (Sample) | 12.9% | 13.2% |
| Standard Deviation (Population) | 12.7% | 13.1% |
Similar Demographics by Wage/Income Gap
Demographics Similar to Immigrants from Denmark by Wage/Income Gap
In terms of wage/income gap, the demographic groups most similar to Immigrants from Denmark are White/Caucasian (28.5%, a difference of 0.010%), Immigrants from South Africa (28.5%, a difference of 0.050%), Immigrants from Netherlands (28.5%, a difference of 0.070%), Polish (28.5%, a difference of 0.070%), and Scotch-Irish (28.5%, a difference of 0.15%).
| Demographics | Rating | Rank | Wage/Income Gap |
| Immigrants | Northern Europe | 0.2 /100 | #300 | Tragic 28.5% |
| Immigrants | Canada | 0.2 /100 | #301 | Tragic 28.5% |
| Scotch-Irish | 0.2 /100 | #302 | Tragic 28.5% |
| Irish | 0.2 /100 | #303 | Tragic 28.5% |
| Immigrants | Netherlands | 0.2 /100 | #304 | Tragic 28.5% |
| Immigrants | South Africa | 0.1 /100 | #305 | Tragic 28.5% |
| Whites/Caucasians | 0.1 /100 | #306 | Tragic 28.5% |
| Immigrants | Denmark | 0.1 /100 | #307 | Tragic 28.5% |
| Poles | 0.1 /100 | #308 | Tragic 28.5% |
| Macedonians | 0.1 /100 | #309 | Tragic 28.6% |
| Finns | 0.1 /100 | #310 | Tragic 28.6% |
| Immigrants | Lithuania | 0.1 /100 | #311 | Tragic 28.6% |
| Eastern Europeans | 0.1 /100 | #312 | Tragic 28.6% |
| French | 0.1 /100 | #313 | Tragic 28.7% |
| Immigrants | Scotland | 0.1 /100 | #314 | Tragic 28.7% |
Demographics Similar to Immigrants from Laos by Wage/Income Gap
In terms of wage/income gap, the demographic groups most similar to Immigrants from Laos are Japanese (23.8%, a difference of 0.14%), Tsimshian (23.9%, a difference of 0.23%), Yakama (23.7%, a difference of 0.30%), Aleut (23.7%, a difference of 0.32%), and Immigrants from Latin America (23.7%, a difference of 0.39%).
| Demographics | Rating | Rank | Wage/Income Gap |
| Cape Verdeans | 99.4 /100 | #95 | Exceptional 23.6% |
| Kiowa | 99.4 /100 | #96 | Exceptional 23.6% |
| Immigrants | Sudan | 99.4 /100 | #97 | Exceptional 23.6% |
| Immigrants | Latin America | 99.2 /100 | #98 | Exceptional 23.7% |
| Aleuts | 99.2 /100 | #99 | Exceptional 23.7% |
| Yakama | 99.2 /100 | #100 | Exceptional 23.7% |
| Japanese | 99.1 /100 | #101 | Exceptional 23.8% |
| Immigrants | Laos | 99.0 /100 | #102 | Exceptional 23.8% |
| Tsimshian | 98.9 /100 | #103 | Exceptional 23.9% |
| Tlingit-Haida | 98.7 /100 | #104 | Exceptional 24.0% |
| Moroccans | 98.6 /100 | #105 | Exceptional 24.0% |
| Sudanese | 98.6 /100 | #106 | Exceptional 24.0% |
| Yaqui | 98.4 /100 | #107 | Exceptional 24.0% |
| Immigrants | Albania | 98.4 /100 | #108 | Exceptional 24.0% |
| Ugandans | 98.3 /100 | #109 | Exceptional 24.1% |