Immigrants from Cuba vs Immigrants from Ukraine Median Earnings
COMPARE
Immigrants from Cuba
Immigrants from Ukraine
Median Earnings
Median Earnings Comparison
Immigrants from Cuba
Immigrants from Ukraine
$38,426
MEDIAN EARNINGS
0.0/ 100
METRIC RATING
337th/ 347
METRIC RANK
$50,984
MEDIAN EARNINGS
99.8/ 100
METRIC RATING
71st/ 347
METRIC RANK
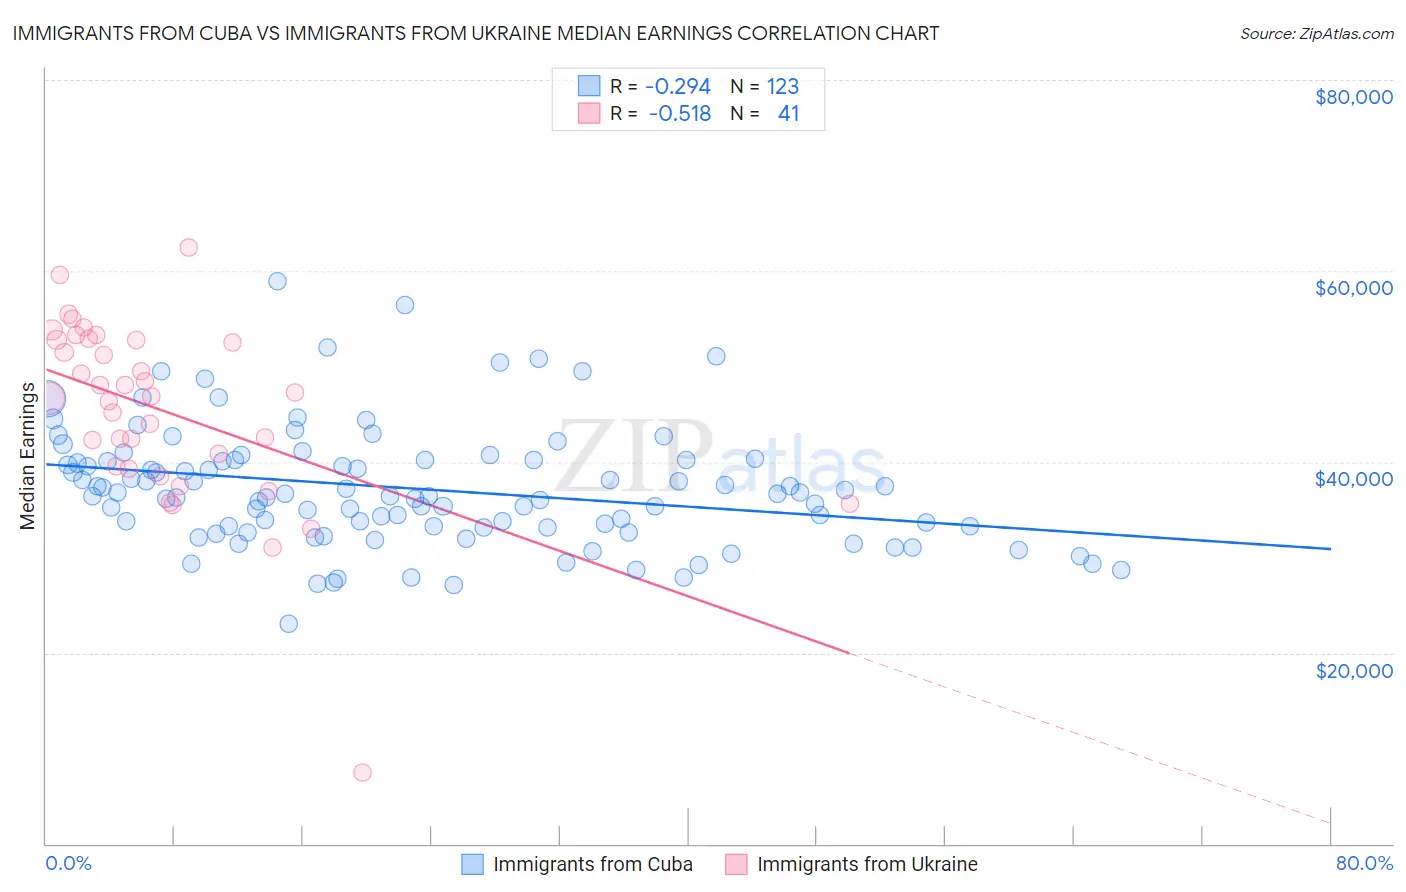
Immigrants from Cuba vs Immigrants from Ukraine Median Earnings Correlation Chart
The statistical analysis conducted on geographies consisting of 326,004,649 people shows a weak negative correlation between the proportion of Immigrants from Cuba and median earnings in the United States with a correlation coefficient (R) of -0.294 and weighted average of $38,426. Similarly, the statistical analysis conducted on geographies consisting of 289,705,710 people shows a substantial negative correlation between the proportion of Immigrants from Ukraine and median earnings in the United States with a correlation coefficient (R) of -0.518 and weighted average of $50,984, a difference of 32.7%.
Median Earnings Correlation Summary
| Measurement | Immigrants from Cuba | Immigrants from Ukraine |
| Minimum | $23,000 | $7,500 |
| Maximum | $58,885 | $62,500 |
| Range | $35,885 | $55,000 |
| Mean | $37,187 | $45,386 |
| Median | $36,411 | $46,915 |
| Interquartile 25% (IQ1) | $33,147 | $39,380 |
| Interquartile 75% (IQ3) | $40,226 | $52,800 |
| Interquartile Range (IQR) | $7,079 | $13,420 |
| Standard Deviation (Sample) | $6,277 | $9,626 |
| Standard Deviation (Population) | $6,251 | $9,508 |
Similar Demographics by Median Earnings
Demographics Similar to Immigrants from Cuba by Median Earnings
In terms of median earnings, the demographic groups most similar to Immigrants from Cuba are Pima ($38,285, a difference of 0.37%), Crow ($38,707, a difference of 0.73%), Native/Alaskan ($38,896, a difference of 1.2%), Spanish American Indian ($38,907, a difference of 1.3%), and Houma ($38,949, a difference of 1.4%).
| Demographics | Rating | Rank | Median Earnings |
| Immigrants | Congo | 0.0 /100 | #330 | Tragic $39,169 |
| Immigrants | Mexico | 0.0 /100 | #331 | Tragic $39,114 |
| Yakama | 0.0 /100 | #332 | Tragic $39,107 |
| Houma | 0.0 /100 | #333 | Tragic $38,949 |
| Spanish American Indians | 0.0 /100 | #334 | Tragic $38,907 |
| Natives/Alaskans | 0.0 /100 | #335 | Tragic $38,896 |
| Crow | 0.0 /100 | #336 | Tragic $38,707 |
| Immigrants | Cuba | 0.0 /100 | #337 | Tragic $38,426 |
| Pima | 0.0 /100 | #338 | Tragic $38,285 |
| Menominee | 0.0 /100 | #339 | Tragic $37,884 |
| Navajo | 0.0 /100 | #340 | Tragic $36,999 |
| Lumbee | 0.0 /100 | #341 | Tragic $36,876 |
| Hopi | 0.0 /100 | #342 | Tragic $36,871 |
| Pueblo | 0.0 /100 | #343 | Tragic $36,859 |
| Arapaho | 0.0 /100 | #344 | Tragic $36,586 |
Demographics Similar to Immigrants from Ukraine by Median Earnings
In terms of median earnings, the demographic groups most similar to Immigrants from Ukraine are Lithuanian ($50,991, a difference of 0.010%), Mongolian ($51,038, a difference of 0.10%), Paraguayan ($51,068, a difference of 0.16%), Immigrants from Egypt ($50,901, a difference of 0.16%), and Immigrants from Spain ($51,092, a difference of 0.21%).
| Demographics | Rating | Rank | Median Earnings |
| New Zealanders | 99.9 /100 | #64 | Exceptional $51,246 |
| Greeks | 99.9 /100 | #65 | Exceptional $51,164 |
| Afghans | 99.9 /100 | #66 | Exceptional $51,112 |
| Immigrants | Spain | 99.9 /100 | #67 | Exceptional $51,092 |
| Paraguayans | 99.9 /100 | #68 | Exceptional $51,068 |
| Mongolians | 99.8 /100 | #69 | Exceptional $51,038 |
| Lithuanians | 99.8 /100 | #70 | Exceptional $50,991 |
| Immigrants | Ukraine | 99.8 /100 | #71 | Exceptional $50,984 |
| Immigrants | Egypt | 99.8 /100 | #72 | Exceptional $50,901 |
| Immigrants | Netherlands | 99.8 /100 | #73 | Exceptional $50,818 |
| South Africans | 99.8 /100 | #74 | Exceptional $50,752 |
| Immigrants | Scotland | 99.8 /100 | #75 | Exceptional $50,741 |
| Immigrants | Italy | 99.7 /100 | #76 | Exceptional $50,581 |
| Immigrants | Western Europe | 99.7 /100 | #77 | Exceptional $50,549 |
| Argentineans | 99.6 /100 | #78 | Exceptional $50,399 |