Immigrants from Cuba vs Immigrants from Croatia Median Earnings
COMPARE
Immigrants from Cuba
Immigrants from Croatia
Median Earnings
Median Earnings Comparison
Immigrants from Cuba
Immigrants from Croatia
$38,426
MEDIAN EARNINGS
0.0/ 100
METRIC RATING
337th/ 347
METRIC RANK
$51,581
MEDIAN EARNINGS
99.9/ 100
METRIC RATING
59th/ 347
METRIC RANK
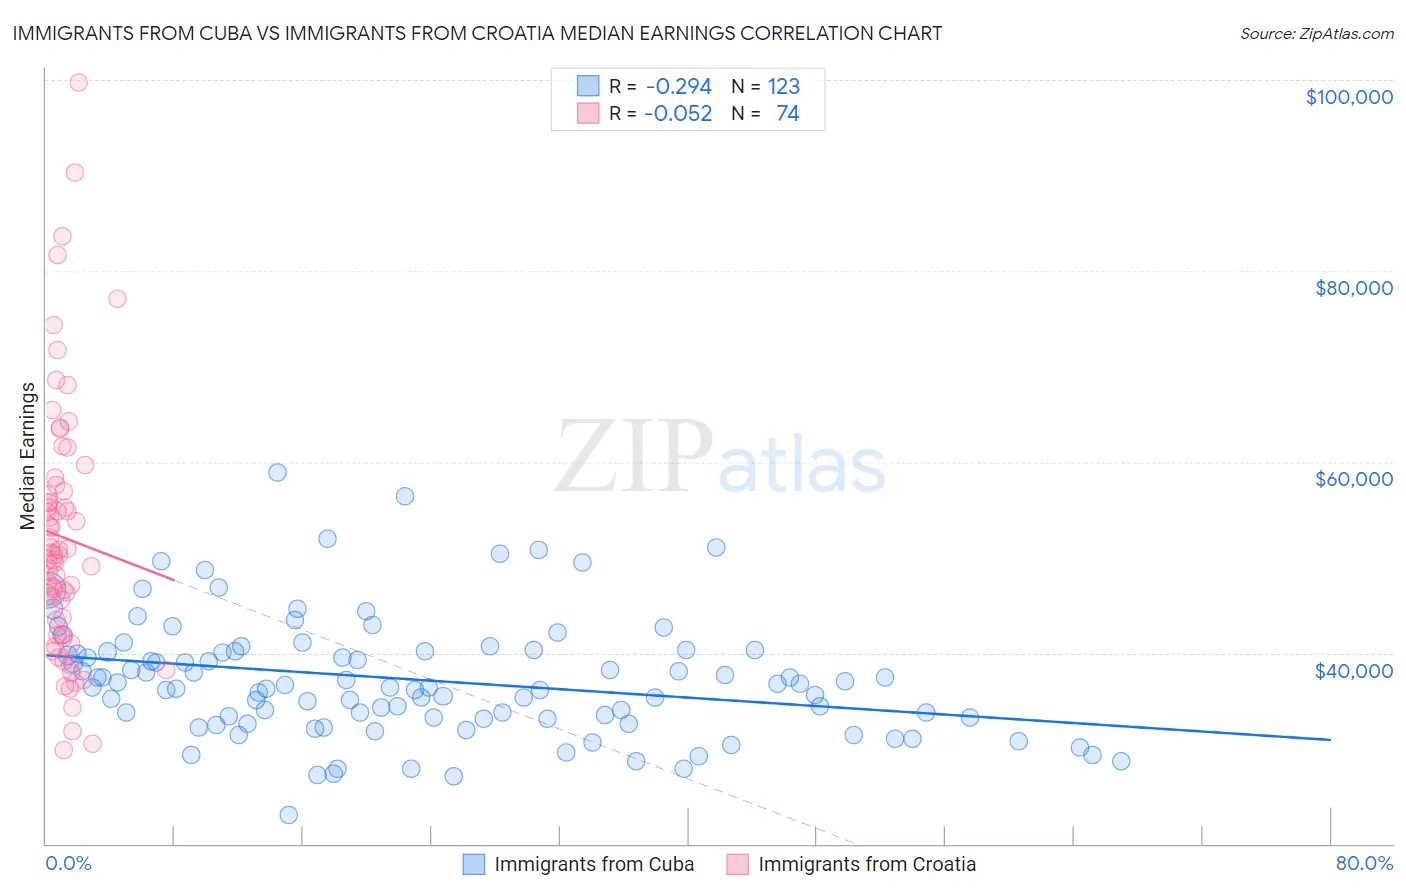
Immigrants from Cuba vs Immigrants from Croatia Median Earnings Correlation Chart
The statistical analysis conducted on geographies consisting of 326,004,649 people shows a weak negative correlation between the proportion of Immigrants from Cuba and median earnings in the United States with a correlation coefficient (R) of -0.294 and weighted average of $38,426. Similarly, the statistical analysis conducted on geographies consisting of 132,573,888 people shows a slight negative correlation between the proportion of Immigrants from Croatia and median earnings in the United States with a correlation coefficient (R) of -0.052 and weighted average of $51,581, a difference of 34.2%.
Median Earnings Correlation Summary
| Measurement | Immigrants from Cuba | Immigrants from Croatia |
| Minimum | $23,000 | $29,868 |
| Maximum | $58,885 | $99,706 |
| Range | $35,885 | $69,838 |
| Mean | $37,187 | $52,095 |
| Median | $36,411 | $50,253 |
| Interquartile 25% (IQ1) | $33,147 | $41,915 |
| Interquartile 75% (IQ3) | $40,226 | $56,902 |
| Interquartile Range (IQR) | $7,079 | $14,987 |
| Standard Deviation (Sample) | $6,277 | $13,541 |
| Standard Deviation (Population) | $6,251 | $13,449 |
Similar Demographics by Median Earnings
Demographics Similar to Immigrants from Cuba by Median Earnings
In terms of median earnings, the demographic groups most similar to Immigrants from Cuba are Pima ($38,285, a difference of 0.37%), Crow ($38,707, a difference of 0.73%), Native/Alaskan ($38,896, a difference of 1.2%), Spanish American Indian ($38,907, a difference of 1.3%), and Houma ($38,949, a difference of 1.4%).
| Demographics | Rating | Rank | Median Earnings |
| Immigrants | Congo | 0.0 /100 | #330 | Tragic $39,169 |
| Immigrants | Mexico | 0.0 /100 | #331 | Tragic $39,114 |
| Yakama | 0.0 /100 | #332 | Tragic $39,107 |
| Houma | 0.0 /100 | #333 | Tragic $38,949 |
| Spanish American Indians | 0.0 /100 | #334 | Tragic $38,907 |
| Natives/Alaskans | 0.0 /100 | #335 | Tragic $38,896 |
| Crow | 0.0 /100 | #336 | Tragic $38,707 |
| Immigrants | Cuba | 0.0 /100 | #337 | Tragic $38,426 |
| Pima | 0.0 /100 | #338 | Tragic $38,285 |
| Menominee | 0.0 /100 | #339 | Tragic $37,884 |
| Navajo | 0.0 /100 | #340 | Tragic $36,999 |
| Lumbee | 0.0 /100 | #341 | Tragic $36,876 |
| Hopi | 0.0 /100 | #342 | Tragic $36,871 |
| Pueblo | 0.0 /100 | #343 | Tragic $36,859 |
| Arapaho | 0.0 /100 | #344 | Tragic $36,586 |
Demographics Similar to Immigrants from Croatia by Median Earnings
In terms of median earnings, the demographic groups most similar to Immigrants from Croatia are Immigrants from Bolivia ($51,605, a difference of 0.050%), Immigrants from Serbia ($51,557, a difference of 0.050%), Immigrants from Latvia ($51,555, a difference of 0.050%), Immigrants from Eastern Europe ($51,624, a difference of 0.080%), and Immigrants from Pakistan ($51,693, a difference of 0.22%).
| Demographics | Rating | Rank | Median Earnings |
| Estonians | 99.9 /100 | #52 | Exceptional $51,772 |
| Immigrants | Norway | 99.9 /100 | #53 | Exceptional $51,758 |
| Immigrants | Indonesia | 99.9 /100 | #54 | Exceptional $51,715 |
| Egyptians | 99.9 /100 | #55 | Exceptional $51,701 |
| Immigrants | Pakistan | 99.9 /100 | #56 | Exceptional $51,693 |
| Immigrants | Eastern Europe | 99.9 /100 | #57 | Exceptional $51,624 |
| Immigrants | Bolivia | 99.9 /100 | #58 | Exceptional $51,605 |
| Immigrants | Croatia | 99.9 /100 | #59 | Exceptional $51,581 |
| Immigrants | Serbia | 99.9 /100 | #60 | Exceptional $51,557 |
| Immigrants | Latvia | 99.9 /100 | #61 | Exceptional $51,555 |
| Immigrants | Romania | 99.9 /100 | #62 | Exceptional $51,337 |
| Immigrants | Bulgaria | 99.9 /100 | #63 | Exceptional $51,318 |
| New Zealanders | 99.9 /100 | #64 | Exceptional $51,246 |
| Greeks | 99.9 /100 | #65 | Exceptional $51,164 |
| Afghans | 99.9 /100 | #66 | Exceptional $51,112 |