Immigrants from Cuba vs Immigrants from Sri Lanka Median Earnings
COMPARE
Immigrants from Cuba
Immigrants from Sri Lanka
Median Earnings
Median Earnings Comparison
Immigrants from Cuba
Immigrants from Sri Lanka
$38,426
MEDIAN EARNINGS
0.0/ 100
METRIC RATING
337th/ 347
METRIC RANK
$53,268
MEDIAN EARNINGS
100.0/ 100
METRIC RATING
34th/ 347
METRIC RANK
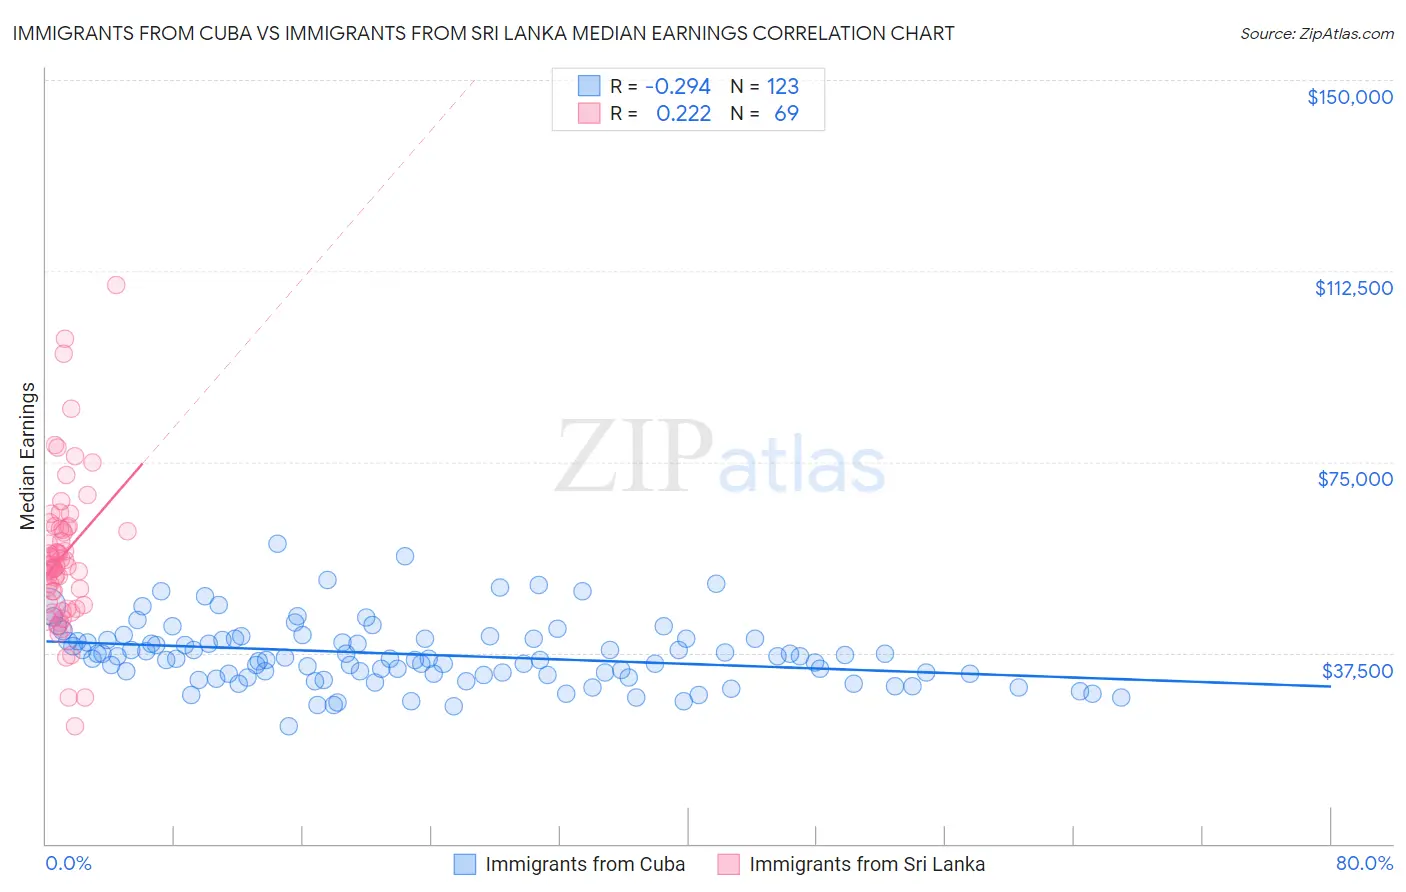
Immigrants from Cuba vs Immigrants from Sri Lanka Median Earnings Correlation Chart
The statistical analysis conducted on geographies consisting of 326,004,649 people shows a weak negative correlation between the proportion of Immigrants from Cuba and median earnings in the United States with a correlation coefficient (R) of -0.294 and weighted average of $38,426. Similarly, the statistical analysis conducted on geographies consisting of 149,698,351 people shows a weak positive correlation between the proportion of Immigrants from Sri Lanka and median earnings in the United States with a correlation coefficient (R) of 0.222 and weighted average of $53,268, a difference of 38.6%.
Median Earnings Correlation Summary
| Measurement | Immigrants from Cuba | Immigrants from Sri Lanka |
| Minimum | $23,000 | $23,025 |
| Maximum | $58,885 | $109,620 |
| Range | $35,885 | $86,595 |
| Mean | $37,187 | $56,667 |
| Median | $36,411 | $54,686 |
| Interquartile 25% (IQ1) | $33,147 | $47,118 |
| Interquartile 75% (IQ3) | $40,226 | $62,136 |
| Interquartile Range (IQR) | $7,079 | $15,018 |
| Standard Deviation (Sample) | $6,277 | $15,005 |
| Standard Deviation (Population) | $6,251 | $14,895 |
Similar Demographics by Median Earnings
Demographics Similar to Immigrants from Cuba by Median Earnings
In terms of median earnings, the demographic groups most similar to Immigrants from Cuba are Pima ($38,285, a difference of 0.37%), Crow ($38,707, a difference of 0.73%), Native/Alaskan ($38,896, a difference of 1.2%), Spanish American Indian ($38,907, a difference of 1.3%), and Houma ($38,949, a difference of 1.4%).
| Demographics | Rating | Rank | Median Earnings |
| Immigrants | Congo | 0.0 /100 | #330 | Tragic $39,169 |
| Immigrants | Mexico | 0.0 /100 | #331 | Tragic $39,114 |
| Yakama | 0.0 /100 | #332 | Tragic $39,107 |
| Houma | 0.0 /100 | #333 | Tragic $38,949 |
| Spanish American Indians | 0.0 /100 | #334 | Tragic $38,907 |
| Natives/Alaskans | 0.0 /100 | #335 | Tragic $38,896 |
| Crow | 0.0 /100 | #336 | Tragic $38,707 |
| Immigrants | Cuba | 0.0 /100 | #337 | Tragic $38,426 |
| Pima | 0.0 /100 | #338 | Tragic $38,285 |
| Menominee | 0.0 /100 | #339 | Tragic $37,884 |
| Navajo | 0.0 /100 | #340 | Tragic $36,999 |
| Lumbee | 0.0 /100 | #341 | Tragic $36,876 |
| Hopi | 0.0 /100 | #342 | Tragic $36,871 |
| Pueblo | 0.0 /100 | #343 | Tragic $36,859 |
| Arapaho | 0.0 /100 | #344 | Tragic $36,586 |
Demographics Similar to Immigrants from Sri Lanka by Median Earnings
In terms of median earnings, the demographic groups most similar to Immigrants from Sri Lanka are Immigrants from Greece ($53,282, a difference of 0.030%), Immigrants from Asia ($53,310, a difference of 0.080%), Immigrants from Switzerland ($53,211, a difference of 0.11%), Russian ($53,334, a difference of 0.12%), and Immigrants from Denmark ($53,186, a difference of 0.15%).
| Demographics | Rating | Rank | Median Earnings |
| Asians | 100.0 /100 | #27 | Exceptional $53,690 |
| Immigrants | France | 100.0 /100 | #28 | Exceptional $53,490 |
| Immigrants | Russia | 100.0 /100 | #29 | Exceptional $53,457 |
| Cambodians | 100.0 /100 | #30 | Exceptional $53,386 |
| Russians | 100.0 /100 | #31 | Exceptional $53,334 |
| Immigrants | Asia | 100.0 /100 | #32 | Exceptional $53,310 |
| Immigrants | Greece | 100.0 /100 | #33 | Exceptional $53,282 |
| Immigrants | Sri Lanka | 100.0 /100 | #34 | Exceptional $53,268 |
| Immigrants | Switzerland | 100.0 /100 | #35 | Exceptional $53,211 |
| Immigrants | Denmark | 100.0 /100 | #36 | Exceptional $53,186 |
| Immigrants | Belarus | 100.0 /100 | #37 | Exceptional $53,043 |
| Latvians | 100.0 /100 | #38 | Exceptional $53,001 |
| Immigrants | Turkey | 100.0 /100 | #39 | Exceptional $52,960 |
| Israelis | 100.0 /100 | #40 | Exceptional $52,937 |
| Immigrants | Lithuania | 100.0 /100 | #41 | Exceptional $52,769 |