Immigrants from Cuba vs Inupiat Median Earnings
COMPARE
Immigrants from Cuba
Inupiat
Median Earnings
Median Earnings Comparison
Immigrants from Cuba
Inupiat
$38,426
MEDIAN EARNINGS
0.0/ 100
METRIC RATING
337th/ 347
METRIC RANK
$43,000
MEDIAN EARNINGS
0.8/ 100
METRIC RATING
263rd/ 347
METRIC RANK
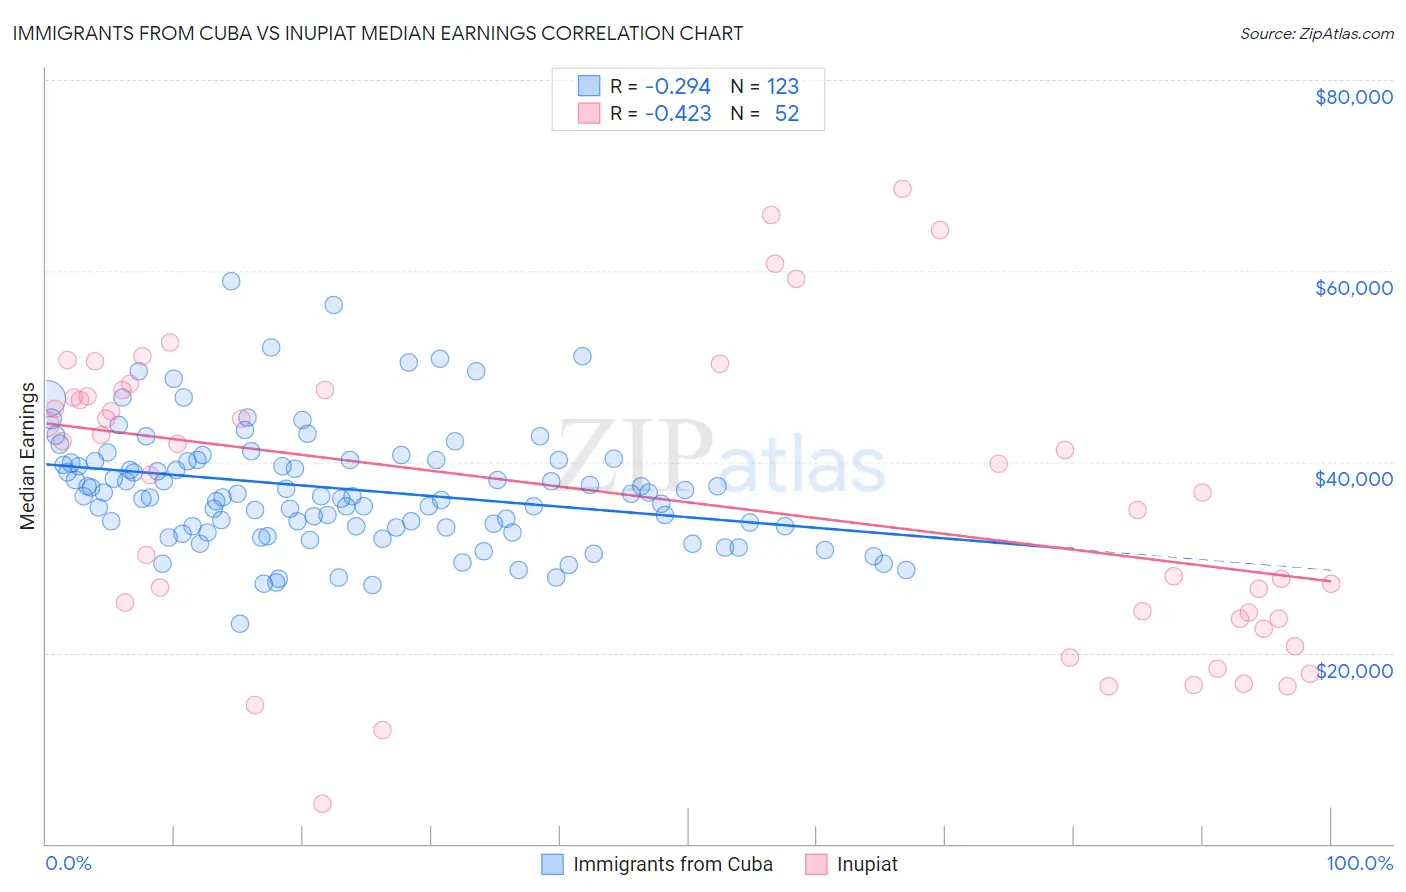
Immigrants from Cuba vs Inupiat Median Earnings Correlation Chart
The statistical analysis conducted on geographies consisting of 326,004,649 people shows a weak negative correlation between the proportion of Immigrants from Cuba and median earnings in the United States with a correlation coefficient (R) of -0.294 and weighted average of $38,426. Similarly, the statistical analysis conducted on geographies consisting of 96,339,660 people shows a moderate negative correlation between the proportion of Inupiat and median earnings in the United States with a correlation coefficient (R) of -0.423 and weighted average of $43,000, a difference of 11.9%.
Median Earnings Correlation Summary
| Measurement | Immigrants from Cuba | Inupiat |
| Minimum | $23,000 | $4,192 |
| Maximum | $58,885 | $68,590 |
| Range | $35,885 | $64,398 |
| Mean | $37,187 | $36,209 |
| Median | $36,411 | $39,208 |
| Interquartile 25% (IQ1) | $33,147 | $23,611 |
| Interquartile 75% (IQ3) | $40,226 | $47,170 |
| Interquartile Range (IQR) | $7,079 | $23,559 |
| Standard Deviation (Sample) | $6,277 | $15,551 |
| Standard Deviation (Population) | $6,251 | $15,401 |
Similar Demographics by Median Earnings
Demographics Similar to Immigrants from Cuba by Median Earnings
In terms of median earnings, the demographic groups most similar to Immigrants from Cuba are Pima ($38,285, a difference of 0.37%), Crow ($38,707, a difference of 0.73%), Native/Alaskan ($38,896, a difference of 1.2%), Spanish American Indian ($38,907, a difference of 1.3%), and Houma ($38,949, a difference of 1.4%).
| Demographics | Rating | Rank | Median Earnings |
| Immigrants | Congo | 0.0 /100 | #330 | Tragic $39,169 |
| Immigrants | Mexico | 0.0 /100 | #331 | Tragic $39,114 |
| Yakama | 0.0 /100 | #332 | Tragic $39,107 |
| Houma | 0.0 /100 | #333 | Tragic $38,949 |
| Spanish American Indians | 0.0 /100 | #334 | Tragic $38,907 |
| Natives/Alaskans | 0.0 /100 | #335 | Tragic $38,896 |
| Crow | 0.0 /100 | #336 | Tragic $38,707 |
| Immigrants | Cuba | 0.0 /100 | #337 | Tragic $38,426 |
| Pima | 0.0 /100 | #338 | Tragic $38,285 |
| Menominee | 0.0 /100 | #339 | Tragic $37,884 |
| Navajo | 0.0 /100 | #340 | Tragic $36,999 |
| Lumbee | 0.0 /100 | #341 | Tragic $36,876 |
| Hopi | 0.0 /100 | #342 | Tragic $36,871 |
| Pueblo | 0.0 /100 | #343 | Tragic $36,859 |
| Arapaho | 0.0 /100 | #344 | Tragic $36,586 |
Demographics Similar to Inupiat by Median Earnings
In terms of median earnings, the demographic groups most similar to Inupiat are Immigrants from Jamaica ($43,026, a difference of 0.060%), Nicaraguan ($43,026, a difference of 0.060%), Immigrants from Liberia ($42,923, a difference of 0.18%), Salvadoran ($42,912, a difference of 0.20%), and Immigrants from Somalia ($43,100, a difference of 0.23%).
| Demographics | Rating | Rank | Median Earnings |
| Alaskan Athabascans | 1.4 /100 | #256 | Tragic $43,393 |
| Jamaicans | 1.3 /100 | #257 | Tragic $43,343 |
| French American Indians | 1.3 /100 | #258 | Tragic $43,333 |
| German Russians | 1.1 /100 | #259 | Tragic $43,200 |
| Immigrants | Somalia | 0.9 /100 | #260 | Tragic $43,100 |
| Immigrants | Jamaica | 0.8 /100 | #261 | Tragic $43,026 |
| Nicaraguans | 0.8 /100 | #262 | Tragic $43,026 |
| Inupiat | 0.8 /100 | #263 | Tragic $43,000 |
| Immigrants | Liberia | 0.7 /100 | #264 | Tragic $42,923 |
| Salvadorans | 0.7 /100 | #265 | Tragic $42,912 |
| Immigrants | Laos | 0.7 /100 | #266 | Tragic $42,884 |
| Cree | 0.6 /100 | #267 | Tragic $42,777 |
| Americans | 0.6 /100 | #268 | Tragic $42,742 |
| Belizeans | 0.5 /100 | #269 | Tragic $42,702 |
| Osage | 0.5 /100 | #270 | Tragic $42,651 |