Immigrants from Cuba vs Ute Median Earnings
COMPARE
Immigrants from Cuba
Ute
Median Earnings
Median Earnings Comparison
Immigrants from Cuba
Ute
$38,426
MEDIAN EARNINGS
0.0/ 100
METRIC RATING
337th/ 347
METRIC RANK
$41,051
MEDIAN EARNINGS
0.1/ 100
METRIC RATING
300th/ 347
METRIC RANK
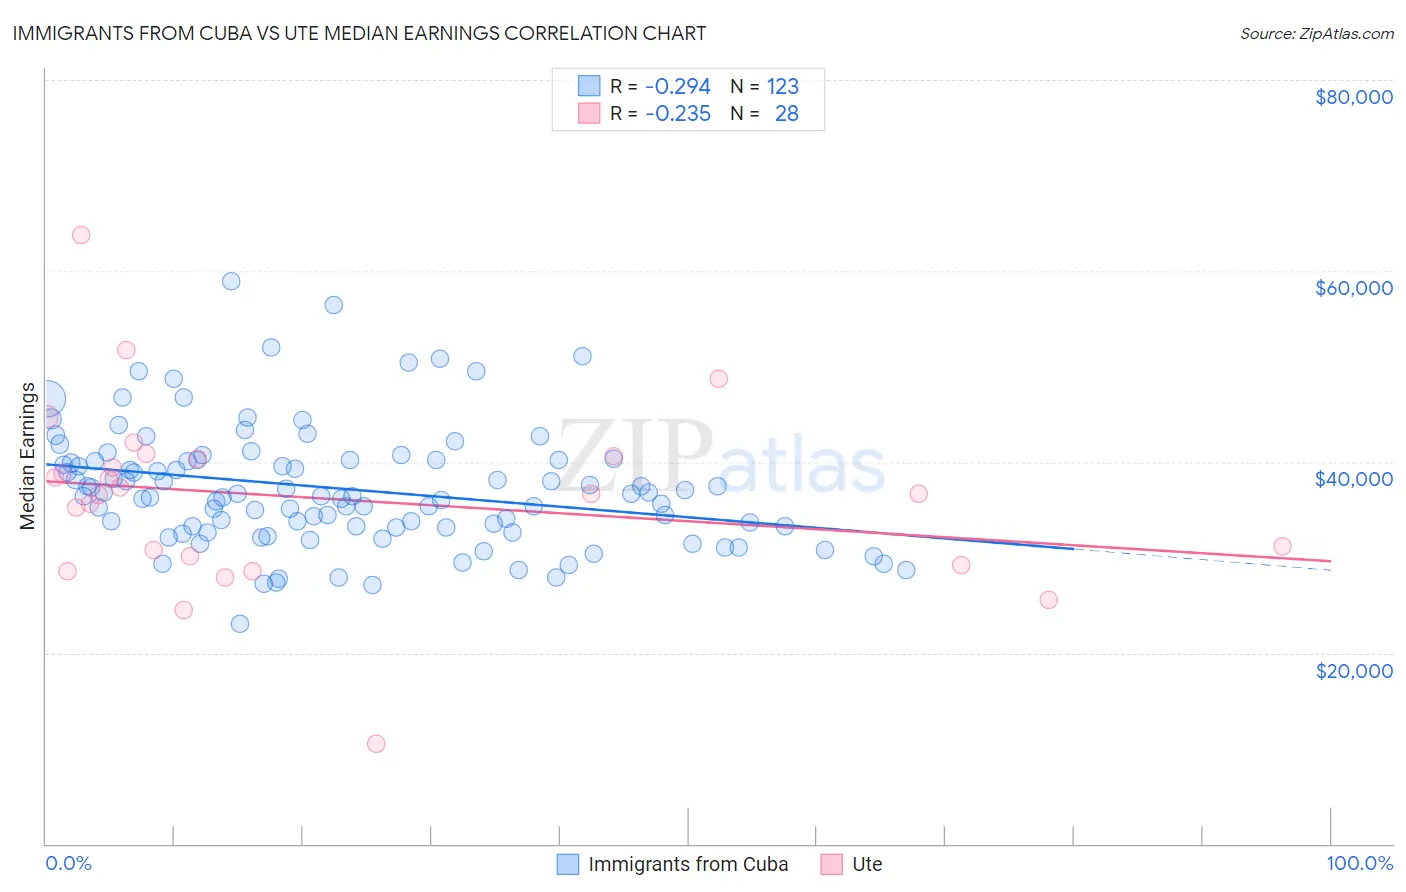
Immigrants from Cuba vs Ute Median Earnings Correlation Chart
The statistical analysis conducted on geographies consisting of 326,004,649 people shows a weak negative correlation between the proportion of Immigrants from Cuba and median earnings in the United States with a correlation coefficient (R) of -0.294 and weighted average of $38,426. Similarly, the statistical analysis conducted on geographies consisting of 55,664,253 people shows a weak negative correlation between the proportion of Ute and median earnings in the United States with a correlation coefficient (R) of -0.235 and weighted average of $41,051, a difference of 6.8%.
Median Earnings Correlation Summary
| Measurement | Immigrants from Cuba | Ute |
| Minimum | $23,000 | $10,500 |
| Maximum | $58,885 | $63,719 |
| Range | $35,885 | $53,219 |
| Mean | $37,187 | $36,165 |
| Median | $36,411 | $36,686 |
| Interquartile 25% (IQ1) | $33,147 | $29,690 |
| Interquartile 75% (IQ3) | $40,226 | $40,497 |
| Interquartile Range (IQR) | $7,079 | $10,807 |
| Standard Deviation (Sample) | $6,277 | $9,794 |
| Standard Deviation (Population) | $6,251 | $9,618 |
Similar Demographics by Median Earnings
Demographics Similar to Immigrants from Cuba by Median Earnings
In terms of median earnings, the demographic groups most similar to Immigrants from Cuba are Pima ($38,285, a difference of 0.37%), Crow ($38,707, a difference of 0.73%), Native/Alaskan ($38,896, a difference of 1.2%), Spanish American Indian ($38,907, a difference of 1.3%), and Houma ($38,949, a difference of 1.4%).
| Demographics | Rating | Rank | Median Earnings |
| Immigrants | Congo | 0.0 /100 | #330 | Tragic $39,169 |
| Immigrants | Mexico | 0.0 /100 | #331 | Tragic $39,114 |
| Yakama | 0.0 /100 | #332 | Tragic $39,107 |
| Houma | 0.0 /100 | #333 | Tragic $38,949 |
| Spanish American Indians | 0.0 /100 | #334 | Tragic $38,907 |
| Natives/Alaskans | 0.0 /100 | #335 | Tragic $38,896 |
| Crow | 0.0 /100 | #336 | Tragic $38,707 |
| Immigrants | Cuba | 0.0 /100 | #337 | Tragic $38,426 |
| Pima | 0.0 /100 | #338 | Tragic $38,285 |
| Menominee | 0.0 /100 | #339 | Tragic $37,884 |
| Navajo | 0.0 /100 | #340 | Tragic $36,999 |
| Lumbee | 0.0 /100 | #341 | Tragic $36,876 |
| Hopi | 0.0 /100 | #342 | Tragic $36,871 |
| Pueblo | 0.0 /100 | #343 | Tragic $36,859 |
| Arapaho | 0.0 /100 | #344 | Tragic $36,586 |
Demographics Similar to Ute by Median Earnings
In terms of median earnings, the demographic groups most similar to Ute are Immigrants from Latin America ($41,049, a difference of 0.010%), Immigrants from Caribbean ($41,119, a difference of 0.17%), Immigrants from Micronesia ($41,133, a difference of 0.20%), Shoshone ($40,932, a difference of 0.29%), and Haitian ($40,918, a difference of 0.32%).
| Demographics | Rating | Rank | Median Earnings |
| Immigrants | Zaire | 0.1 /100 | #293 | Tragic $41,325 |
| Potawatomi | 0.1 /100 | #294 | Tragic $41,288 |
| Bangladeshis | 0.1 /100 | #295 | Tragic $41,263 |
| Cherokee | 0.1 /100 | #296 | Tragic $41,252 |
| Guatemalans | 0.1 /100 | #297 | Tragic $41,205 |
| Immigrants | Micronesia | 0.1 /100 | #298 | Tragic $41,133 |
| Immigrants | Caribbean | 0.1 /100 | #299 | Tragic $41,119 |
| Ute | 0.1 /100 | #300 | Tragic $41,051 |
| Immigrants | Latin America | 0.1 /100 | #301 | Tragic $41,049 |
| Shoshone | 0.0 /100 | #302 | Tragic $40,932 |
| Haitians | 0.0 /100 | #303 | Tragic $40,918 |
| Immigrants | Guatemala | 0.0 /100 | #304 | Tragic $40,851 |
| Chickasaw | 0.0 /100 | #305 | Tragic $40,672 |
| Yaqui | 0.0 /100 | #306 | Tragic $40,647 |
| Hondurans | 0.0 /100 | #307 | Tragic $40,638 |