Immigrants from Cameroon vs Immigrants from Japan Child Poverty Under the Age of 5
COMPARE
Immigrants from Cameroon
Immigrants from Japan
Child Poverty Under the Age of 5
Child Poverty Under the Age of 5 Comparison
Immigrants from Cameroon
Immigrants from Japan
17.4%
CHILD POVERTY UNDER THE AGE OF 5
42.7/ 100
METRIC RATING
178th/ 347
METRIC RANK
13.8%
CHILD POVERTY UNDER THE AGE OF 5
100.0/ 100
METRIC RATING
20th/ 347
METRIC RANK
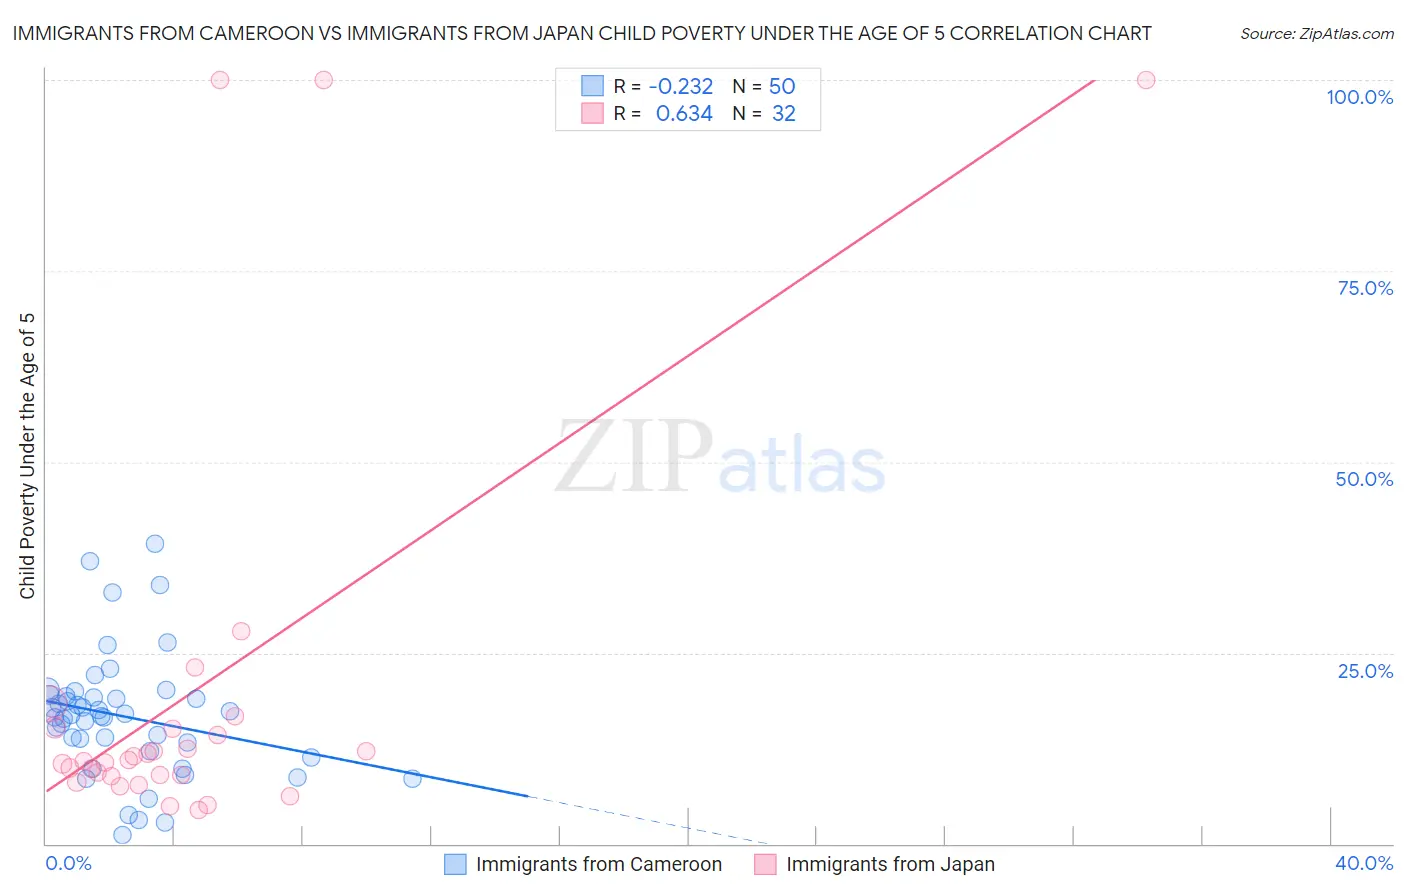
Immigrants from Cameroon vs Immigrants from Japan Child Poverty Under the Age of 5 Correlation Chart
The statistical analysis conducted on geographies consisting of 129,546,892 people shows a weak negative correlation between the proportion of Immigrants from Cameroon and poverty level among children under the age of 5 in the United States with a correlation coefficient (R) of -0.232 and weighted average of 17.4%. Similarly, the statistical analysis conducted on geographies consisting of 328,132,973 people shows a significant positive correlation between the proportion of Immigrants from Japan and poverty level among children under the age of 5 in the United States with a correlation coefficient (R) of 0.634 and weighted average of 13.8%, a difference of 26.0%.
Child Poverty Under the Age of 5 Correlation Summary
| Measurement | Immigrants from Cameroon | Immigrants from Japan |
| Minimum | 1.2% | 4.4% |
| Maximum | 39.2% | 100.0% |
| Range | 38.1% | 95.6% |
| Mean | 16.6% | 19.8% |
| Median | 16.8% | 10.9% |
| Interquartile 25% (IQ1) | 12.2% | 8.9% |
| Interquartile 75% (IQ3) | 19.3% | 15.1% |
| Interquartile Range (IQR) | 7.1% | 6.2% |
| Standard Deviation (Sample) | 8.0% | 26.7% |
| Standard Deviation (Population) | 7.9% | 26.2% |
Similar Demographics by Child Poverty Under the Age of 5
Demographics Similar to Immigrants from Cameroon by Child Poverty Under the Age of 5
In terms of child poverty under the age of 5, the demographic groups most similar to Immigrants from Cameroon are Immigrants from Sierra Leone (17.3%, a difference of 0.10%), Hawaiian (17.4%, a difference of 0.13%), South American Indian (17.4%, a difference of 0.13%), Immigrants from Germany (17.4%, a difference of 0.18%), and Arab (17.4%, a difference of 0.21%).
| Demographics | Rating | Rank | Child Poverty Under the Age of 5 |
| Immigrants | Morocco | 58.9 /100 | #171 | Average 17.1% |
| Yugoslavians | 54.1 /100 | #172 | Average 17.2% |
| Welsh | 54.0 /100 | #173 | Average 17.2% |
| Immigrants | Saudi Arabia | 50.0 /100 | #174 | Average 17.2% |
| Immigrants | Lebanon | 47.6 /100 | #175 | Average 17.3% |
| Immigrants | Iraq | 45.2 /100 | #176 | Average 17.3% |
| Immigrants | Sierra Leone | 43.6 /100 | #177 | Average 17.3% |
| Immigrants | Cameroon | 42.7 /100 | #178 | Average 17.4% |
| Hawaiians | 41.5 /100 | #179 | Average 17.4% |
| South American Indians | 41.4 /100 | #180 | Average 17.4% |
| Immigrants | Germany | 41.0 /100 | #181 | Average 17.4% |
| Arabs | 40.7 /100 | #182 | Average 17.4% |
| Lebanese | 40.3 /100 | #183 | Average 17.4% |
| Immigrants | Costa Rica | 39.0 /100 | #184 | Fair 17.4% |
| Immigrants | Armenia | 38.0 /100 | #185 | Fair 17.5% |
Demographics Similar to Immigrants from Japan by Child Poverty Under the Age of 5
In terms of child poverty under the age of 5, the demographic groups most similar to Immigrants from Japan are Bolivian (13.8%, a difference of 0.30%), Immigrants from Bolivia (13.8%, a difference of 0.38%), Immigrants from Ireland (13.7%, a difference of 0.40%), Bulgarian (13.9%, a difference of 0.82%), and Immigrants from China (13.6%, a difference of 1.3%).
| Demographics | Rating | Rank | Child Poverty Under the Age of 5 |
| Bhutanese | 100.0 /100 | #13 | Exceptional 13.4% |
| Okinawans | 100.0 /100 | #14 | Exceptional 13.4% |
| Indians (Asian) | 100.0 /100 | #15 | Exceptional 13.4% |
| Immigrants | Eastern Asia | 100.0 /100 | #16 | Exceptional 13.5% |
| Assyrians/Chaldeans/Syriacs | 100.0 /100 | #17 | Exceptional 13.6% |
| Immigrants | China | 100.0 /100 | #18 | Exceptional 13.6% |
| Immigrants | Ireland | 100.0 /100 | #19 | Exceptional 13.7% |
| Immigrants | Japan | 100.0 /100 | #20 | Exceptional 13.8% |
| Bolivians | 100.0 /100 | #21 | Exceptional 13.8% |
| Immigrants | Bolivia | 100.0 /100 | #22 | Exceptional 13.8% |
| Bulgarians | 99.9 /100 | #23 | Exceptional 13.9% |
| Asians | 99.9 /100 | #24 | Exceptional 14.0% |
| Cypriots | 99.9 /100 | #25 | Exceptional 14.0% |
| Immigrants | Lithuania | 99.9 /100 | #26 | Exceptional 14.1% |
| Tongans | 99.9 /100 | #27 | Exceptional 14.2% |