Palestinian vs Central American Median Male Earnings
COMPARE
Palestinian
Central American
Median Male Earnings
Median Male Earnings Comparison
Palestinians
Central Americans
$57,778
MEDIAN MALE EARNINGS
96.2/ 100
METRIC RATING
110th/ 347
METRIC RANK
$48,093
MEDIAN MALE EARNINGS
0.2/ 100
METRIC RATING
282nd/ 347
METRIC RANK
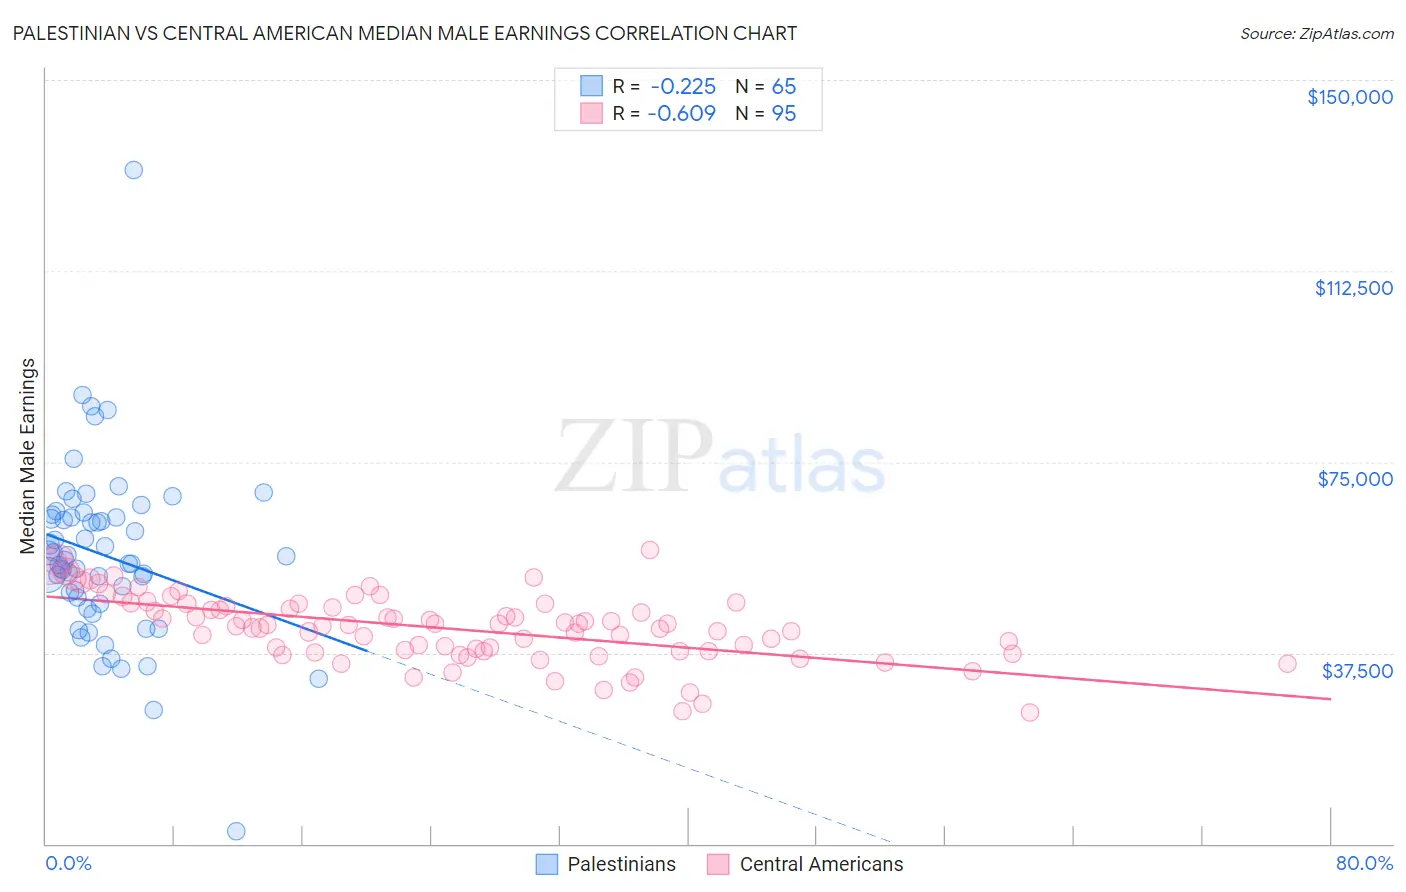
Palestinian vs Central American Median Male Earnings Correlation Chart
The statistical analysis conducted on geographies consisting of 216,446,429 people shows a weak negative correlation between the proportion of Palestinians and median male earnings in the United States with a correlation coefficient (R) of -0.225 and weighted average of $57,778. Similarly, the statistical analysis conducted on geographies consisting of 504,312,553 people shows a significant negative correlation between the proportion of Central Americans and median male earnings in the United States with a correlation coefficient (R) of -0.609 and weighted average of $48,093, a difference of 20.1%.
Median Male Earnings Correlation Summary
| Measurement | Palestinian | Central American |
| Minimum | $2,499 | $25,893 |
| Maximum | $132,344 | $57,715 |
| Range | $129,845 | $31,822 |
| Mean | $56,632 | $42,312 |
| Median | $55,657 | $42,955 |
| Interquartile 25% (IQ1) | $47,716 | $37,781 |
| Interquartile 75% (IQ3) | $64,385 | $47,084 |
| Interquartile Range (IQR) | $16,670 | $9,303 |
| Standard Deviation (Sample) | $17,442 | $6,615 |
| Standard Deviation (Population) | $17,308 | $6,580 |
Similar Demographics by Median Male Earnings
Demographics Similar to Palestinians by Median Male Earnings
In terms of median male earnings, the demographic groups most similar to Palestinians are British ($57,890, a difference of 0.19%), European ($57,637, a difference of 0.25%), Immigrants from Uzbekistan ($57,941, a difference of 0.28%), Serbian ($57,975, a difference of 0.34%), and Immigrants from Afghanistan ($57,582, a difference of 0.34%).
| Demographics | Rating | Rank | Median Male Earnings |
| Poles | 97.3 /100 | #103 | Exceptional $58,139 |
| Armenians | 97.3 /100 | #104 | Exceptional $58,134 |
| Immigrants | Western Asia | 97.3 /100 | #105 | Exceptional $58,131 |
| Immigrants | Northern Africa | 96.9 /100 | #106 | Exceptional $58,008 |
| Serbians | 96.8 /100 | #107 | Exceptional $57,975 |
| Immigrants | Uzbekistan | 96.7 /100 | #108 | Exceptional $57,941 |
| British | 96.5 /100 | #109 | Exceptional $57,890 |
| Palestinians | 96.2 /100 | #110 | Exceptional $57,778 |
| Europeans | 95.6 /100 | #111 | Exceptional $57,637 |
| Immigrants | Afghanistan | 95.4 /100 | #112 | Exceptional $57,582 |
| Carpatho Rusyns | 95.3 /100 | #113 | Exceptional $57,572 |
| Immigrants | Kuwait | 95.3 /100 | #114 | Exceptional $57,562 |
| Swedes | 94.8 /100 | #115 | Exceptional $57,445 |
| Lebanese | 94.6 /100 | #116 | Exceptional $57,409 |
| Immigrants | Zimbabwe | 94.3 /100 | #117 | Exceptional $57,352 |
Demographics Similar to Central Americans by Median Male Earnings
In terms of median male earnings, the demographic groups most similar to Central Americans are Marshallese ($48,137, a difference of 0.090%), Immigrants from Jamaica ($48,040, a difference of 0.11%), African ($47,994, a difference of 0.21%), Paiute ($47,991, a difference of 0.21%), and Mexican American Indian ($47,990, a difference of 0.22%).
| Demographics | Rating | Rank | Median Male Earnings |
| Immigrants | Somalia | 0.3 /100 | #275 | Tragic $48,439 |
| Blackfeet | 0.3 /100 | #276 | Tragic $48,402 |
| Belizeans | 0.2 /100 | #277 | Tragic $48,358 |
| Immigrants | Liberia | 0.2 /100 | #278 | Tragic $48,317 |
| Hmong | 0.2 /100 | #279 | Tragic $48,254 |
| Comanche | 0.2 /100 | #280 | Tragic $48,202 |
| Marshallese | 0.2 /100 | #281 | Tragic $48,137 |
| Central Americans | 0.2 /100 | #282 | Tragic $48,093 |
| Immigrants | Jamaica | 0.2 /100 | #283 | Tragic $48,040 |
| Africans | 0.2 /100 | #284 | Tragic $47,994 |
| Paiute | 0.2 /100 | #285 | Tragic $47,991 |
| Mexican American Indians | 0.2 /100 | #286 | Tragic $47,990 |
| Immigrants | El Salvador | 0.2 /100 | #287 | Tragic $47,973 |
| Shoshone | 0.2 /100 | #288 | Tragic $47,930 |
| Chickasaw | 0.1 /100 | #289 | Tragic $47,832 |