Yaqui vs Central American Median Male Earnings
COMPARE
Yaqui
Central American
Median Male Earnings
Median Male Earnings Comparison
Yaqui
Central Americans
$46,777
MEDIAN MALE EARNINGS
0.1/ 100
METRIC RATING
303rd/ 347
METRIC RANK
$48,093
MEDIAN MALE EARNINGS
0.2/ 100
METRIC RATING
282nd/ 347
METRIC RANK
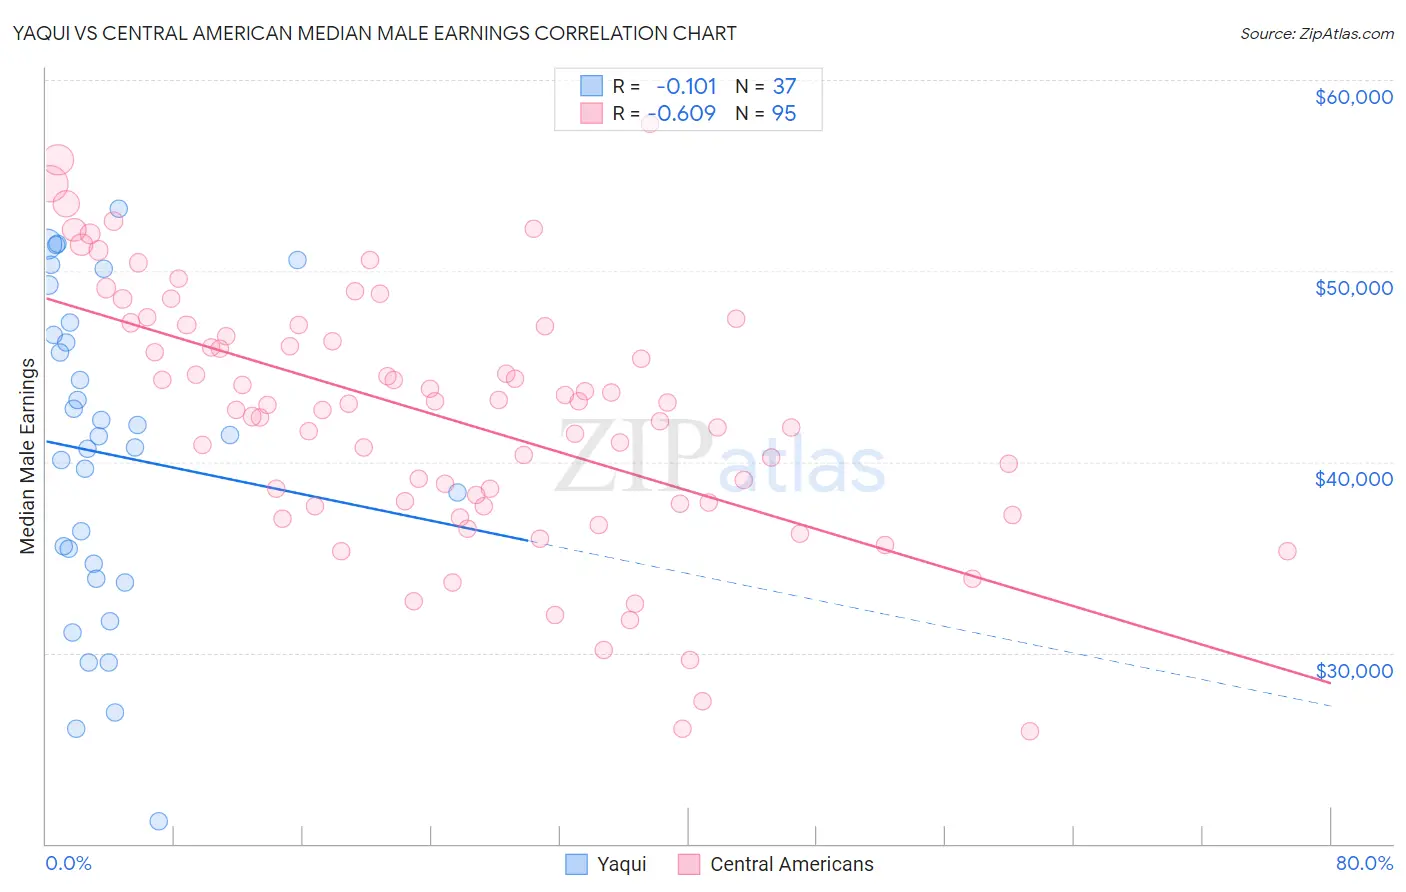
Yaqui vs Central American Median Male Earnings Correlation Chart
The statistical analysis conducted on geographies consisting of 107,723,867 people shows a poor negative correlation between the proportion of Yaqui and median male earnings in the United States with a correlation coefficient (R) of -0.101 and weighted average of $46,777. Similarly, the statistical analysis conducted on geographies consisting of 504,312,553 people shows a significant negative correlation between the proportion of Central Americans and median male earnings in the United States with a correlation coefficient (R) of -0.609 and weighted average of $48,093, a difference of 2.8%.
Median Male Earnings Correlation Summary
| Measurement | Yaqui | Central American |
| Minimum | $21,192 | $25,893 |
| Maximum | $53,274 | $57,715 |
| Range | $32,082 | $31,822 |
| Mean | $40,430 | $42,312 |
| Median | $41,328 | $42,955 |
| Interquartile 25% (IQ1) | $34,244 | $37,781 |
| Interquartile 75% (IQ3) | $46,983 | $47,084 |
| Interquartile Range (IQR) | $12,738 | $9,303 |
| Standard Deviation (Sample) | $8,232 | $6,615 |
| Standard Deviation (Population) | $8,120 | $6,580 |
Similar Demographics by Median Male Earnings
Demographics Similar to Yaqui by Median Male Earnings
In terms of median male earnings, the demographic groups most similar to Yaqui are Seminole ($46,783, a difference of 0.010%), Bangladeshi ($46,744, a difference of 0.070%), Guatemalan ($46,736, a difference of 0.090%), Dutch West Indian ($46,656, a difference of 0.26%), and Immigrants from Dominican Republic ($46,655, a difference of 0.26%).
| Demographics | Rating | Rank | Median Male Earnings |
| Inupiat | 0.1 /100 | #296 | Tragic $47,281 |
| Dominicans | 0.1 /100 | #297 | Tragic $47,204 |
| Immigrants | Micronesia | 0.1 /100 | #298 | Tragic $47,177 |
| Immigrants | Zaire | 0.1 /100 | #299 | Tragic $47,070 |
| U.S. Virgin Islanders | 0.1 /100 | #300 | Tragic $47,066 |
| Immigrants | Latin America | 0.1 /100 | #301 | Tragic $46,941 |
| Seminole | 0.1 /100 | #302 | Tragic $46,783 |
| Yaqui | 0.1 /100 | #303 | Tragic $46,777 |
| Bangladeshis | 0.1 /100 | #304 | Tragic $46,744 |
| Guatemalans | 0.0 /100 | #305 | Tragic $46,736 |
| Dutch West Indians | 0.0 /100 | #306 | Tragic $46,656 |
| Immigrants | Dominican Republic | 0.0 /100 | #307 | Tragic $46,655 |
| Ottawa | 0.0 /100 | #308 | Tragic $46,611 |
| Creek | 0.0 /100 | #309 | Tragic $46,594 |
| Cubans | 0.0 /100 | #310 | Tragic $46,580 |
Demographics Similar to Central Americans by Median Male Earnings
In terms of median male earnings, the demographic groups most similar to Central Americans are Marshallese ($48,137, a difference of 0.090%), Immigrants from Jamaica ($48,040, a difference of 0.11%), African ($47,994, a difference of 0.21%), Paiute ($47,991, a difference of 0.21%), and Mexican American Indian ($47,990, a difference of 0.22%).
| Demographics | Rating | Rank | Median Male Earnings |
| Immigrants | Somalia | 0.3 /100 | #275 | Tragic $48,439 |
| Blackfeet | 0.3 /100 | #276 | Tragic $48,402 |
| Belizeans | 0.2 /100 | #277 | Tragic $48,358 |
| Immigrants | Liberia | 0.2 /100 | #278 | Tragic $48,317 |
| Hmong | 0.2 /100 | #279 | Tragic $48,254 |
| Comanche | 0.2 /100 | #280 | Tragic $48,202 |
| Marshallese | 0.2 /100 | #281 | Tragic $48,137 |
| Central Americans | 0.2 /100 | #282 | Tragic $48,093 |
| Immigrants | Jamaica | 0.2 /100 | #283 | Tragic $48,040 |
| Africans | 0.2 /100 | #284 | Tragic $47,994 |
| Paiute | 0.2 /100 | #285 | Tragic $47,991 |
| Mexican American Indians | 0.2 /100 | #286 | Tragic $47,990 |
| Immigrants | El Salvador | 0.2 /100 | #287 | Tragic $47,973 |
| Shoshone | 0.2 /100 | #288 | Tragic $47,930 |
| Chickasaw | 0.1 /100 | #289 | Tragic $47,832 |