English vs Central American Median Male Earnings
COMPARE
English
Central American
Median Male Earnings
Median Male Earnings Comparison
English
Central Americans
$55,747
MEDIAN MALE EARNINGS
77.4/ 100
METRIC RATING
149th/ 347
METRIC RANK
$48,093
MEDIAN MALE EARNINGS
0.2/ 100
METRIC RATING
282nd/ 347
METRIC RANK
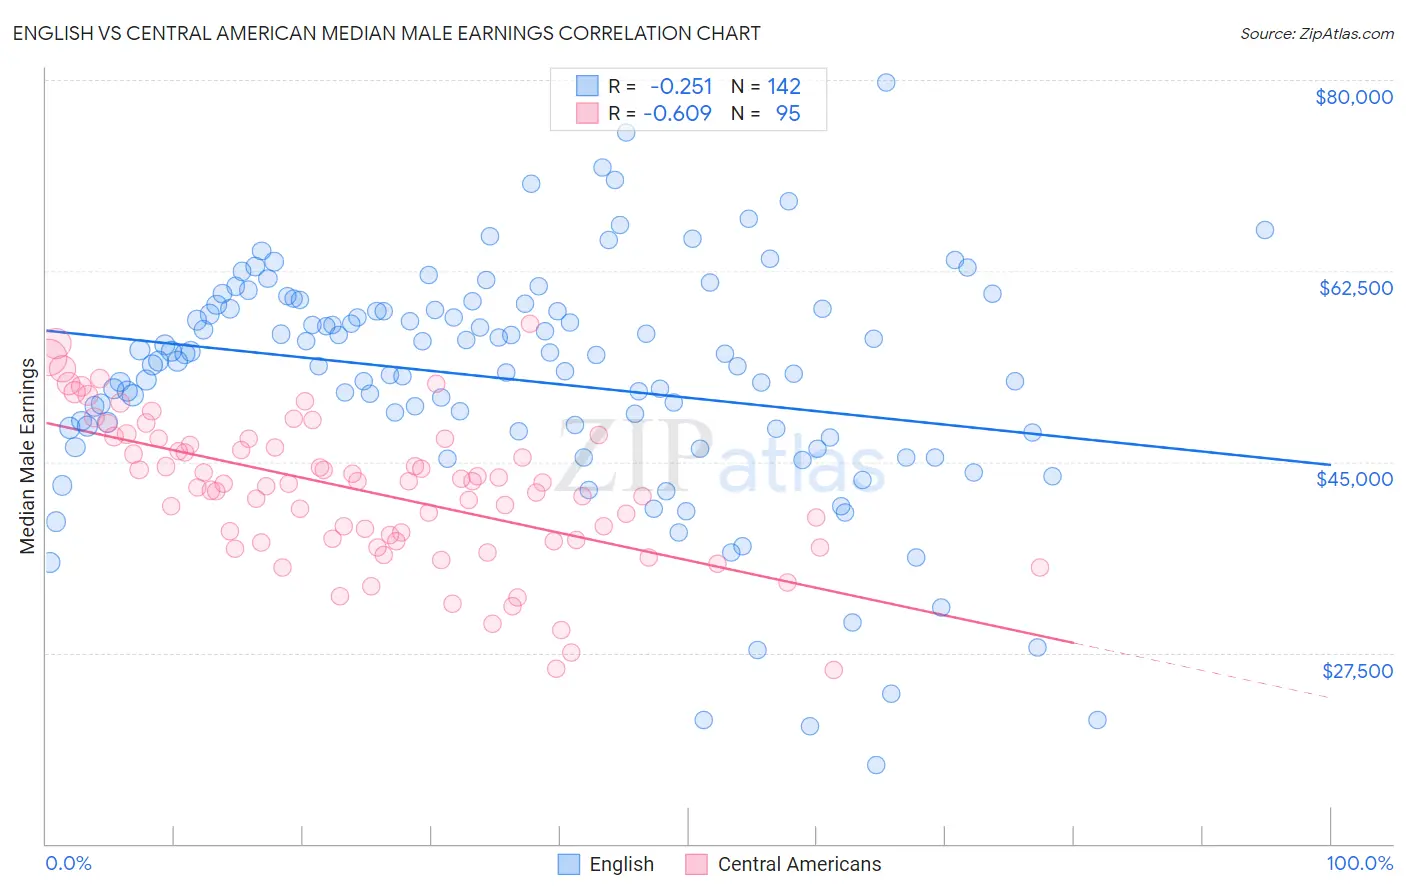
English vs Central American Median Male Earnings Correlation Chart
The statistical analysis conducted on geographies consisting of 577,846,764 people shows a weak negative correlation between the proportion of English and median male earnings in the United States with a correlation coefficient (R) of -0.251 and weighted average of $55,747. Similarly, the statistical analysis conducted on geographies consisting of 504,312,553 people shows a significant negative correlation between the proportion of Central Americans and median male earnings in the United States with a correlation coefficient (R) of -0.609 and weighted average of $48,093, a difference of 15.9%.
Median Male Earnings Correlation Summary
| Measurement | English | Central American |
| Minimum | $17,188 | $25,893 |
| Maximum | $79,824 | $57,715 |
| Range | $62,636 | $31,822 |
| Mean | $52,541 | $42,312 |
| Median | $54,211 | $42,955 |
| Interquartile 25% (IQ1) | $47,796 | $37,781 |
| Interquartile 75% (IQ3) | $58,992 | $47,084 |
| Interquartile Range (IQR) | $11,196 | $9,303 |
| Standard Deviation (Sample) | $10,836 | $6,615 |
| Standard Deviation (Population) | $10,798 | $6,580 |
Similar Demographics by Median Male Earnings
Demographics Similar to English by Median Male Earnings
In terms of median male earnings, the demographic groups most similar to English are Swiss ($55,731, a difference of 0.030%), Immigrants from Oceania ($55,712, a difference of 0.060%), Scottish ($55,793, a difference of 0.080%), Immigrants from Philippines ($55,809, a difference of 0.11%), and Peruvian ($55,659, a difference of 0.16%).
| Demographics | Rating | Rank | Median Male Earnings |
| Ethiopians | 84.8 /100 | #142 | Excellent $56,243 |
| Sri Lankans | 83.4 /100 | #143 | Excellent $56,136 |
| Immigrants | Uganda | 82.4 /100 | #144 | Excellent $56,064 |
| Norwegians | 80.9 /100 | #145 | Excellent $55,965 |
| Immigrants | Chile | 80.7 /100 | #146 | Excellent $55,954 |
| Immigrants | Philippines | 78.4 /100 | #147 | Good $55,809 |
| Scottish | 78.2 /100 | #148 | Good $55,793 |
| English | 77.4 /100 | #149 | Good $55,747 |
| Swiss | 77.1 /100 | #150 | Good $55,731 |
| Immigrants | Oceania | 76.8 /100 | #151 | Good $55,712 |
| Peruvians | 75.8 /100 | #152 | Good $55,659 |
| Immigrants | Nepal | 75.0 /100 | #153 | Good $55,615 |
| Taiwanese | 73.9 /100 | #154 | Good $55,556 |
| Scandinavians | 73.4 /100 | #155 | Good $55,527 |
| Immigrants | Ethiopia | 71.6 /100 | #156 | Good $55,434 |
Demographics Similar to Central Americans by Median Male Earnings
In terms of median male earnings, the demographic groups most similar to Central Americans are Marshallese ($48,137, a difference of 0.090%), Immigrants from Jamaica ($48,040, a difference of 0.11%), African ($47,994, a difference of 0.21%), Paiute ($47,991, a difference of 0.21%), and Mexican American Indian ($47,990, a difference of 0.22%).
| Demographics | Rating | Rank | Median Male Earnings |
| Immigrants | Somalia | 0.3 /100 | #275 | Tragic $48,439 |
| Blackfeet | 0.3 /100 | #276 | Tragic $48,402 |
| Belizeans | 0.2 /100 | #277 | Tragic $48,358 |
| Immigrants | Liberia | 0.2 /100 | #278 | Tragic $48,317 |
| Hmong | 0.2 /100 | #279 | Tragic $48,254 |
| Comanche | 0.2 /100 | #280 | Tragic $48,202 |
| Marshallese | 0.2 /100 | #281 | Tragic $48,137 |
| Central Americans | 0.2 /100 | #282 | Tragic $48,093 |
| Immigrants | Jamaica | 0.2 /100 | #283 | Tragic $48,040 |
| Africans | 0.2 /100 | #284 | Tragic $47,994 |
| Paiute | 0.2 /100 | #285 | Tragic $47,991 |
| Mexican American Indians | 0.2 /100 | #286 | Tragic $47,990 |
| Immigrants | El Salvador | 0.2 /100 | #287 | Tragic $47,973 |
| Shoshone | 0.2 /100 | #288 | Tragic $47,930 |
| Chickasaw | 0.1 /100 | #289 | Tragic $47,832 |