Immigrants from Bahamas vs Immigrants from Ecuador Unemployment Among Youth under 25 years
COMPARE
Immigrants from Bahamas
Immigrants from Ecuador
Unemployment Among Youth under 25 years
Unemployment Among Youth under 25 years Comparison
Immigrants from Bahamas
Immigrants from Ecuador
12.9%
UNEMPLOYMENT AMONG YOUTH UNDER 25 YEARS
0.0/ 100
METRIC RATING
271st/ 347
METRIC RANK
13.4%
UNEMPLOYMENT AMONG YOUTH UNDER 25 YEARS
0.0/ 100
METRIC RATING
290th/ 347
METRIC RANK
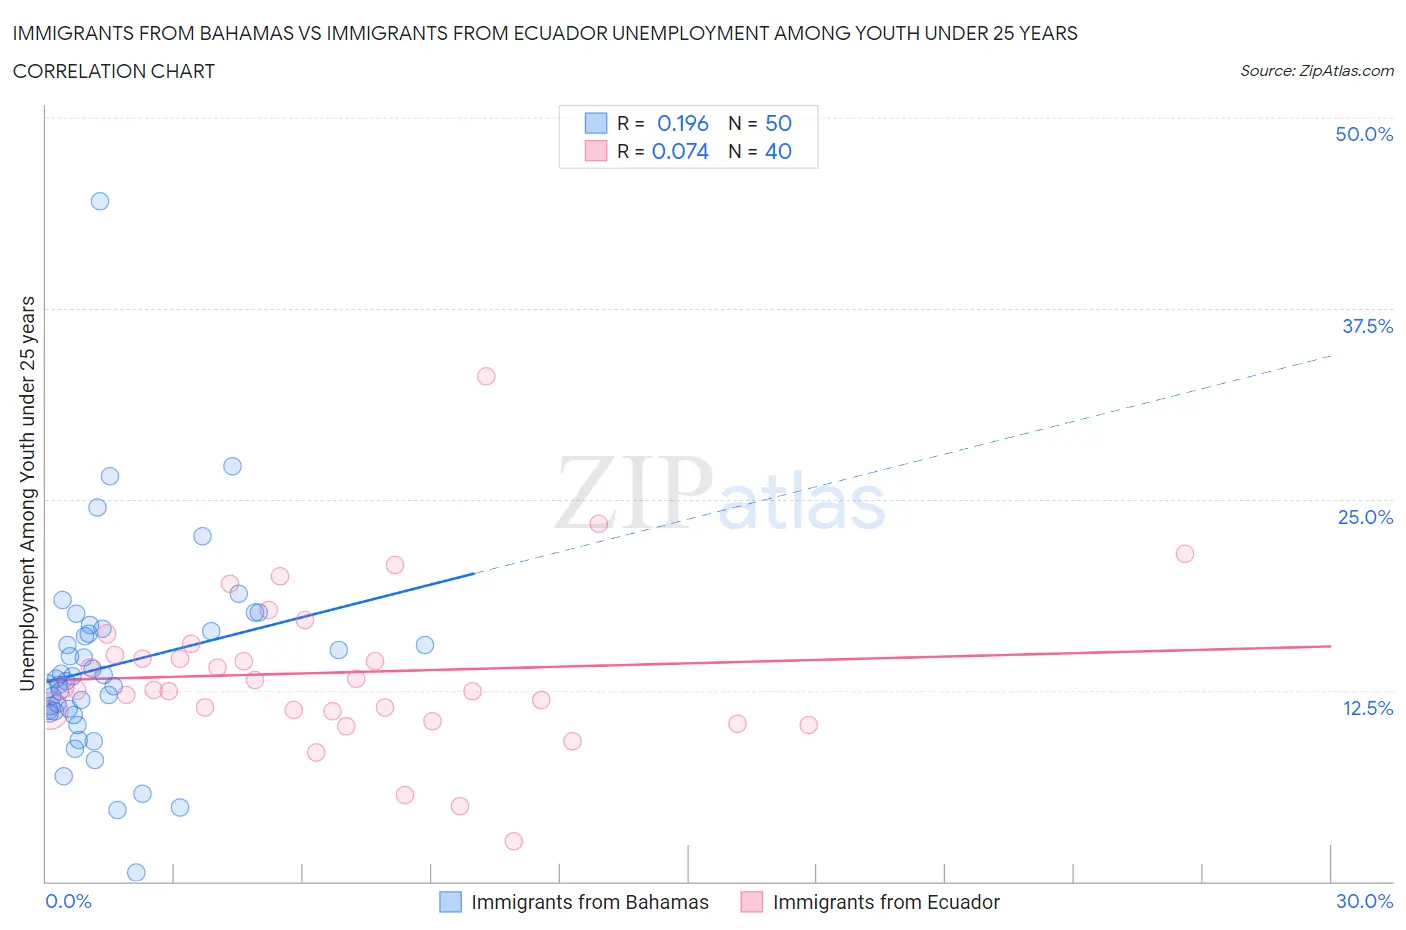
Immigrants from Bahamas vs Immigrants from Ecuador Unemployment Among Youth under 25 years Correlation Chart
The statistical analysis conducted on geographies consisting of 104,451,024 people shows a poor positive correlation between the proportion of Immigrants from Bahamas and unemployment rate among youth under the age of 25 in the United States with a correlation coefficient (R) of 0.196 and weighted average of 12.9%. Similarly, the statistical analysis conducted on geographies consisting of 269,322,147 people shows a slight positive correlation between the proportion of Immigrants from Ecuador and unemployment rate among youth under the age of 25 in the United States with a correlation coefficient (R) of 0.074 and weighted average of 13.4%, a difference of 4.2%.
Unemployment Among Youth under 25 years Correlation Summary
| Measurement | Immigrants from Bahamas | Immigrants from Ecuador |
| Minimum | 0.60% | 2.6% |
| Maximum | 44.5% | 33.1% |
| Range | 43.9% | 30.5% |
| Mean | 14.1% | 13.7% |
| Median | 13.2% | 12.6% |
| Interquartile 25% (IQ1) | 11.1% | 11.1% |
| Interquartile 75% (IQ3) | 16.4% | 15.2% |
| Interquartile Range (IQR) | 5.3% | 4.0% |
| Standard Deviation (Sample) | 6.7% | 5.3% |
| Standard Deviation (Population) | 6.7% | 5.2% |
Demographics Similar to Immigrants from Bahamas and Immigrants from Ecuador by Unemployment Among Youth under 25 years
In terms of unemployment among youth under 25 years, the demographic groups most similar to Immigrants from Bahamas are Cape Verdean (12.9%, a difference of 0.22%), Immigrants from Liberia (12.8%, a difference of 0.53%), Nigerian (13.0%, a difference of 0.57%), Immigrants from Nigeria (13.0%, a difference of 1.1%), and Bermudan (13.0%, a difference of 1.3%). Similarly, the demographic groups most similar to Immigrants from Ecuador are Immigrants from Ghana (13.4%, a difference of 0.34%), Immigrants from Western Africa (13.4%, a difference of 0.46%), Blackfeet (13.3%, a difference of 0.89%), Ecuadorian (13.3%, a difference of 0.89%), and Ghanaian (13.3%, a difference of 0.94%).
| Demographics | Rating | Rank | Unemployment Among Youth under 25 years |
| Immigrants | Liberia | 0.0 /100 | #270 | Tragic 12.8% |
| Immigrants | Bahamas | 0.0 /100 | #271 | Tragic 12.9% |
| Cape Verdeans | 0.0 /100 | #272 | Tragic 12.9% |
| Nigerians | 0.0 /100 | #273 | Tragic 13.0% |
| Immigrants | Nigeria | 0.0 /100 | #274 | Tragic 13.0% |
| Bermudans | 0.0 /100 | #275 | Tragic 13.0% |
| Immigrants | Uzbekistan | 0.0 /100 | #276 | Tragic 13.1% |
| Bahamians | 0.0 /100 | #277 | Tragic 13.1% |
| Africans | 0.0 /100 | #278 | Tragic 13.2% |
| Cajuns | 0.0 /100 | #279 | Tragic 13.2% |
| Ute | 0.0 /100 | #280 | Tragic 13.3% |
| Armenians | 0.0 /100 | #281 | Tragic 13.3% |
| Sierra Leoneans | 0.0 /100 | #282 | Tragic 13.3% |
| Immigrants | Cameroon | 0.0 /100 | #283 | Tragic 13.3% |
| Lumbee | 0.0 /100 | #284 | Tragic 13.3% |
| Ghanaians | 0.0 /100 | #285 | Tragic 13.3% |
| Blackfeet | 0.0 /100 | #286 | Tragic 13.3% |
| Ecuadorians | 0.0 /100 | #287 | Tragic 13.3% |
| Immigrants | Western Africa | 0.0 /100 | #288 | Tragic 13.4% |
| Immigrants | Ghana | 0.0 /100 | #289 | Tragic 13.4% |
| Immigrants | Ecuador | 0.0 /100 | #290 | Tragic 13.4% |