Immigrants from Argentina vs South American Unemployment Among Women with Children Under 6 years
COMPARE
Immigrants from Argentina
South American
Unemployment Among Women with Children Under 6 years
Unemployment Among Women with Children Under 6 years Comparison
Immigrants from Argentina
South Americans
7.5%
UNEMPLOYMENT AMONG WOMEN WITH CHILDREN UNDER 6 YEARS
81.5/ 100
METRIC RATING
142nd/ 347
METRIC RANK
7.5%
UNEMPLOYMENT AMONG WOMEN WITH CHILDREN UNDER 6 YEARS
74.1/ 100
METRIC RATING
155th/ 347
METRIC RANK
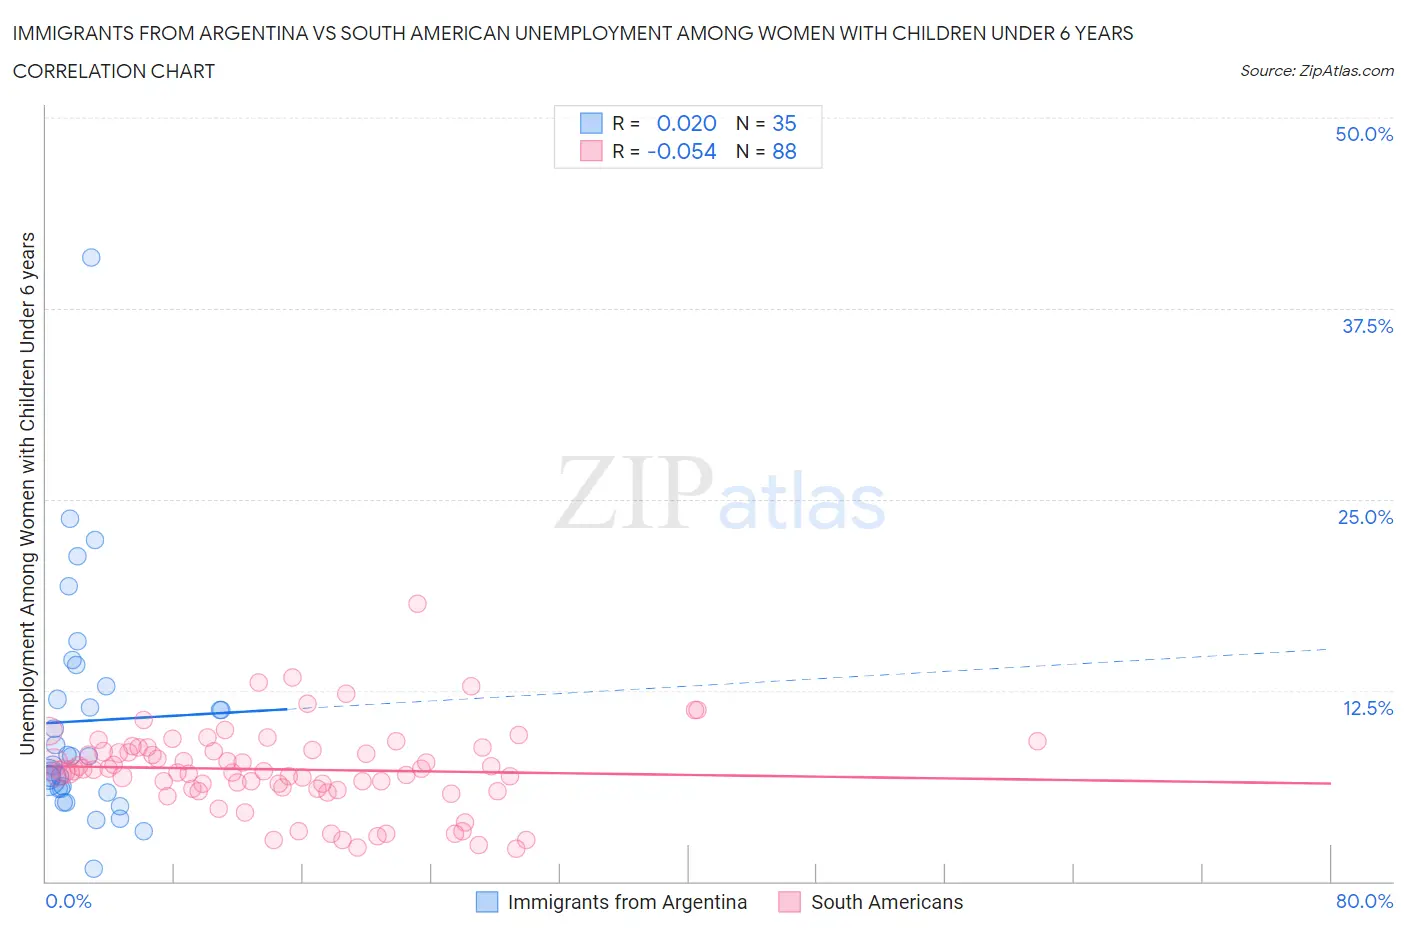
Immigrants from Argentina vs South American Unemployment Among Women with Children Under 6 years Correlation Chart
The statistical analysis conducted on geographies consisting of 215,800,646 people shows no correlation between the proportion of Immigrants from Argentina and unemployment rate among women with children under the age of 6 in the United States with a correlation coefficient (R) of 0.020 and weighted average of 7.5%. Similarly, the statistical analysis conducted on geographies consisting of 355,844,194 people shows a slight negative correlation between the proportion of South Americans and unemployment rate among women with children under the age of 6 in the United States with a correlation coefficient (R) of -0.054 and weighted average of 7.5%, a difference of 0.73%.
Unemployment Among Women with Children Under 6 years Correlation Summary
| Measurement | Immigrants from Argentina | South American |
| Minimum | 0.80% | 2.1% |
| Maximum | 40.8% | 18.2% |
| Range | 40.0% | 16.1% |
| Mean | 10.5% | 7.3% |
| Median | 8.2% | 7.3% |
| Interquartile 25% (IQ1) | 6.0% | 6.0% |
| Interquartile 75% (IQ3) | 12.8% | 8.7% |
| Interquartile Range (IQR) | 6.7% | 2.6% |
| Standard Deviation (Sample) | 7.6% | 2.8% |
| Standard Deviation (Population) | 7.5% | 2.7% |
Demographics Similar to Immigrants from Argentina and South Americans by Unemployment Among Women with Children Under 6 years
In terms of unemployment among women with children under 6 years, the demographic groups most similar to Immigrants from Argentina are Korean (7.5%, a difference of 0.020%), Greek (7.4%, a difference of 0.12%), Scandinavian (7.4%, a difference of 0.18%), European (7.5%, a difference of 0.25%), and Immigrants from Jordan (7.5%, a difference of 0.28%). Similarly, the demographic groups most similar to South Americans are Northern European (7.5%, a difference of 0.020%), Uruguayan (7.5%, a difference of 0.050%), Bangladeshi (7.5%, a difference of 0.060%), Immigrants from Peru (7.5%, a difference of 0.070%), and Immigrants from Southern Europe (7.5%, a difference of 0.080%).
| Demographics | Rating | Rank | Unemployment Among Women with Children Under 6 years |
| Immigrants | Norway | 84.1 /100 | #138 | Excellent 7.4% |
| Immigrants | Colombia | 83.9 /100 | #139 | Excellent 7.4% |
| Scandinavians | 83.0 /100 | #140 | Excellent 7.4% |
| Greeks | 82.6 /100 | #141 | Excellent 7.4% |
| Immigrants | Argentina | 81.5 /100 | #142 | Excellent 7.5% |
| Koreans | 81.3 /100 | #143 | Excellent 7.5% |
| Europeans | 79.1 /100 | #144 | Good 7.5% |
| Immigrants | Jordan | 78.9 /100 | #145 | Good 7.5% |
| Japanese | 78.9 /100 | #146 | Good 7.5% |
| Immigrants | Oceania | 78.4 /100 | #147 | Good 7.5% |
| Immigrants | Brazil | 77.3 /100 | #148 | Good 7.5% |
| Colombians | 76.1 /100 | #149 | Good 7.5% |
| Aleuts | 76.0 /100 | #150 | Good 7.5% |
| Immigrants | Peru | 74.9 /100 | #151 | Good 7.5% |
| Bangladeshis | 74.8 /100 | #152 | Good 7.5% |
| Uruguayans | 74.7 /100 | #153 | Good 7.5% |
| Northern Europeans | 74.3 /100 | #154 | Good 7.5% |
| South Americans | 74.1 /100 | #155 | Good 7.5% |
| Immigrants | Southern Europe | 73.2 /100 | #156 | Good 7.5% |
| Peruvians | 72.3 /100 | #157 | Good 7.5% |
| Croatians | 71.9 /100 | #158 | Good 7.5% |