Hungarian vs Indian (Asian) Wage/Income Gap
COMPARE
Hungarian
Indian (Asian)
Wage/Income Gap
Wage/Income Gap Comparison
Hungarians
Indians (Asian)
29.0%
WAGE/INCOME GAP
0.0/ 100
METRIC RATING
325th/ 347
METRIC RANK
26.4%
WAGE/INCOME GAP
16.5/ 100
METRIC RATING
206th/ 347
METRIC RANK
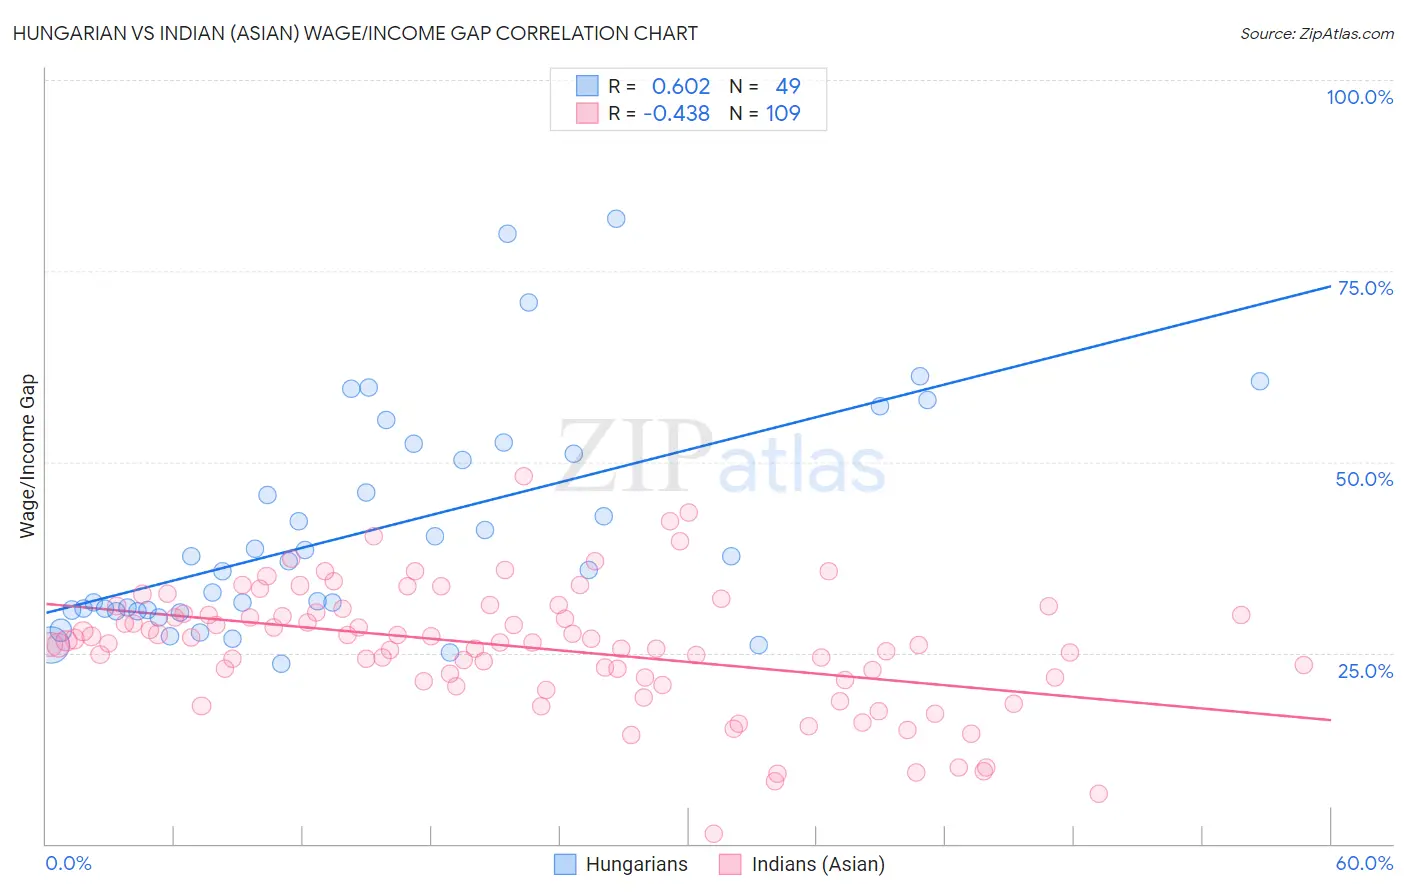
Hungarian vs Indian (Asian) Wage/Income Gap Correlation Chart
The statistical analysis conducted on geographies consisting of 485,427,318 people shows a significant positive correlation between the proportion of Hungarians and wage/income gap percentage in the United States with a correlation coefficient (R) of 0.602 and weighted average of 29.0%. Similarly, the statistical analysis conducted on geographies consisting of 494,711,771 people shows a moderate negative correlation between the proportion of Indians (Asian) and wage/income gap percentage in the United States with a correlation coefficient (R) of -0.438 and weighted average of 26.4%, a difference of 9.7%.
Wage/Income Gap Correlation Summary
| Measurement | Hungarian | Indian (Asian) |
| Minimum | 23.5% | 1.2% |
| Maximum | 81.8% | 48.1% |
| Range | 58.3% | 46.8% |
| Mean | 41.1% | 25.8% |
| Median | 37.0% | 26.4% |
| Interquartile 25% (IQ1) | 30.6% | 21.6% |
| Interquartile 75% (IQ3) | 51.8% | 30.6% |
| Interquartile Range (IQR) | 21.2% | 9.0% |
| Standard Deviation (Sample) | 14.5% | 8.2% |
| Standard Deviation (Population) | 14.3% | 8.1% |
Similar Demographics by Wage/Income Gap
Demographics Similar to Hungarians by Wage/Income Gap
In terms of wage/income gap, the demographic groups most similar to Hungarians are Immigrants from Belgium (29.0%, a difference of 0.070%), Croatian (29.0%, a difference of 0.13%), Immigrants from Iran (29.1%, a difference of 0.18%), Scandinavian (29.1%, a difference of 0.24%), and Norwegian (29.0%, a difference of 0.25%).
| Demographics | Rating | Rank | Wage/Income Gap |
| Basques | 0.1 /100 | #318 | Tragic 28.8% |
| Slovaks | 0.1 /100 | #319 | Tragic 28.9% |
| British | 0.1 /100 | #320 | Tragic 28.9% |
| Welsh | 0.1 /100 | #321 | Tragic 28.9% |
| Immigrants | Singapore | 0.1 /100 | #322 | Tragic 28.9% |
| Norwegians | 0.1 /100 | #323 | Tragic 29.0% |
| Croatians | 0.0 /100 | #324 | Tragic 29.0% |
| Hungarians | 0.0 /100 | #325 | Tragic 29.0% |
| Immigrants | Belgium | 0.0 /100 | #326 | Tragic 29.0% |
| Immigrants | Iran | 0.0 /100 | #327 | Tragic 29.1% |
| Scandinavians | 0.0 /100 | #328 | Tragic 29.1% |
| Scottish | 0.0 /100 | #329 | Tragic 29.1% |
| Germans | 0.0 /100 | #330 | Tragic 29.2% |
| Czechs | 0.0 /100 | #331 | Tragic 29.2% |
| Immigrants | South Central Asia | 0.0 /100 | #332 | Tragic 29.3% |
Demographics Similar to Indians (Asian) by Wage/Income Gap
In terms of wage/income gap, the demographic groups most similar to Indians (Asian) are Immigrants from Italy (26.5%, a difference of 0.080%), Immigrants from Southern Europe (26.4%, a difference of 0.090%), Immigrants from Russia (26.4%, a difference of 0.27%), Laotian (26.4%, a difference of 0.29%), and Immigrants from Eastern Europe (26.4%, a difference of 0.29%).
| Demographics | Rating | Rank | Wage/Income Gap |
| Dutch West Indians | 21.0 /100 | #199 | Fair 26.3% |
| Delaware | 20.9 /100 | #200 | Fair 26.3% |
| Immigrants | Syria | 19.3 /100 | #201 | Poor 26.4% |
| Laotians | 19.2 /100 | #202 | Poor 26.4% |
| Immigrants | Eastern Europe | 19.2 /100 | #203 | Poor 26.4% |
| Immigrants | Russia | 19.0 /100 | #204 | Poor 26.4% |
| Immigrants | Southern Europe | 17.3 /100 | #205 | Poor 26.4% |
| Indians (Asian) | 16.5 /100 | #206 | Poor 26.4% |
| Immigrants | Italy | 15.8 /100 | #207 | Poor 26.5% |
| Egyptians | 12.7 /100 | #208 | Poor 26.6% |
| Immigrants | Kuwait | 12.6 /100 | #209 | Poor 26.6% |
| Arabs | 12.3 /100 | #210 | Poor 26.6% |
| Mongolians | 11.4 /100 | #211 | Poor 26.6% |
| Iraqis | 11.2 /100 | #212 | Poor 26.6% |
| Immigrants | Iraq | 10.3 /100 | #213 | Poor 26.7% |