Houma vs Immigrants from Micronesia In Labor Force | Age 35-44
COMPARE
Houma
Immigrants from Micronesia
In Labor Force | Age 35-44
In Labor Force | Age 35-44 Comparison
Houma
Immigrants from Micronesia
79.5%
IN LABOR FORCE | AGE 35-44
0.0/ 100
METRIC RATING
331st/ 347
METRIC RANK
83.1%
IN LABOR FORCE | AGE 35-44
0.0/ 100
METRIC RATING
279th/ 347
METRIC RANK
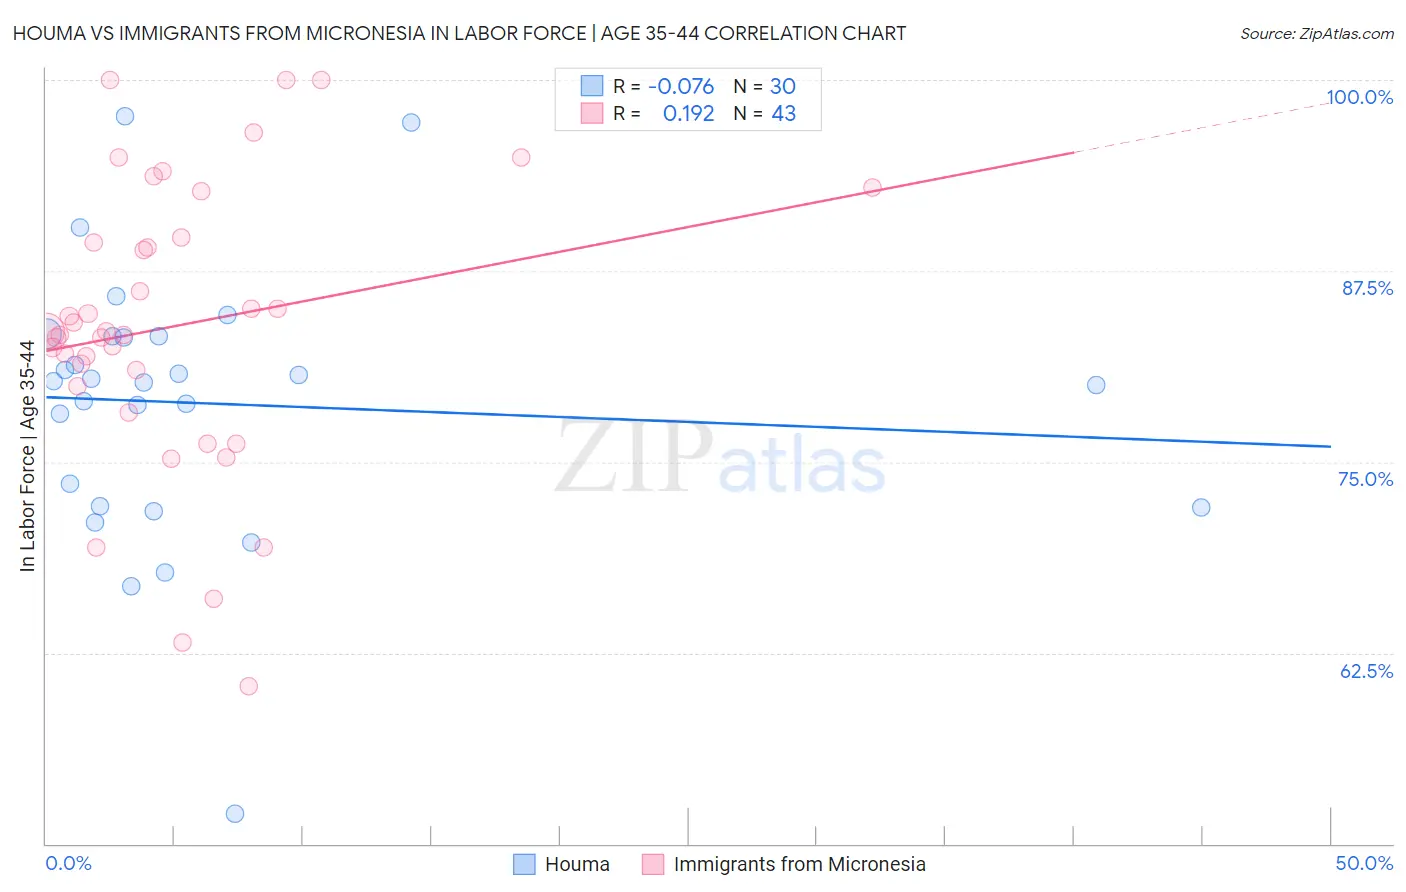
Houma vs Immigrants from Micronesia In Labor Force | Age 35-44 Correlation Chart
The statistical analysis conducted on geographies consisting of 36,793,405 people shows a slight negative correlation between the proportion of Houma and labor force participation rate among population between the ages 35 and 44 in the United States with a correlation coefficient (R) of -0.076 and weighted average of 79.5%. Similarly, the statistical analysis conducted on geographies consisting of 61,600,178 people shows a poor positive correlation between the proportion of Immigrants from Micronesia and labor force participation rate among population between the ages 35 and 44 in the United States with a correlation coefficient (R) of 0.192 and weighted average of 83.1%, a difference of 4.6%.
In Labor Force | Age 35-44 Correlation Summary
| Measurement | Houma | Immigrants from Micronesia |
| Minimum | 52.0% | 60.3% |
| Maximum | 97.6% | 100.0% |
| Range | 45.6% | 39.7% |
| Mean | 78.8% | 83.9% |
| Median | 80.2% | 83.6% |
| Interquartile 25% (IQ1) | 72.1% | 79.9% |
| Interquartile 75% (IQ3) | 83.2% | 89.7% |
| Interquartile Range (IQR) | 11.1% | 9.8% |
| Standard Deviation (Sample) | 8.9% | 9.4% |
| Standard Deviation (Population) | 8.8% | 9.3% |
Similar Demographics by In Labor Force | Age 35-44
Demographics Similar to Houma by In Labor Force | Age 35-44
In terms of in labor force | age 35-44, the demographic groups most similar to Houma are Cheyenne (79.5%, a difference of 0.020%), Ute (79.4%, a difference of 0.060%), Menominee (79.7%, a difference of 0.22%), Kiowa (79.2%, a difference of 0.39%), and Creek (80.0%, a difference of 0.66%).
| Demographics | Rating | Rank | In Labor Force | Age 35-44 |
| Choctaw | 0.0 /100 | #324 | Tragic 80.5% |
| Dutch West Indians | 0.0 /100 | #325 | Tragic 80.4% |
| Seminole | 0.0 /100 | #326 | Tragic 80.4% |
| Sioux | 0.0 /100 | #327 | Tragic 80.2% |
| Creek | 0.0 /100 | #328 | Tragic 80.0% |
| Menominee | 0.0 /100 | #329 | Tragic 79.7% |
| Cheyenne | 0.0 /100 | #330 | Tragic 79.5% |
| Houma | 0.0 /100 | #331 | Tragic 79.5% |
| Ute | 0.0 /100 | #332 | Tragic 79.4% |
| Kiowa | 0.0 /100 | #333 | Tragic 79.2% |
| Yakama | 0.0 /100 | #334 | Tragic 79.0% |
| Natives/Alaskans | 0.0 /100 | #335 | Tragic 78.9% |
| Arapaho | 0.0 /100 | #336 | Tragic 78.1% |
| Apache | 0.0 /100 | #337 | Tragic 77.9% |
| Pueblo | 0.0 /100 | #338 | Tragic 77.4% |
Demographics Similar to Immigrants from Micronesia by In Labor Force | Age 35-44
In terms of in labor force | age 35-44, the demographic groups most similar to Immigrants from Micronesia are Belizean (83.1%, a difference of 0.010%), Dominican (83.1%, a difference of 0.040%), Samoan (83.2%, a difference of 0.080%), Delaware (83.2%, a difference of 0.090%), and Hawaiian (83.2%, a difference of 0.10%).
| Demographics | Rating | Rank | In Labor Force | Age 35-44 |
| Immigrants | Fiji | 0.0 /100 | #272 | Tragic 83.2% |
| Spanish | 0.0 /100 | #273 | Tragic 83.2% |
| Immigrants | Nonimmigrants | 0.0 /100 | #274 | Tragic 83.2% |
| Hawaiians | 0.0 /100 | #275 | Tragic 83.2% |
| Delaware | 0.0 /100 | #276 | Tragic 83.2% |
| Samoans | 0.0 /100 | #277 | Tragic 83.2% |
| Belizeans | 0.0 /100 | #278 | Tragic 83.1% |
| Immigrants | Micronesia | 0.0 /100 | #279 | Tragic 83.1% |
| Dominicans | 0.0 /100 | #280 | Tragic 83.1% |
| Guatemalans | 0.0 /100 | #281 | Tragic 83.0% |
| Osage | 0.0 /100 | #282 | Tragic 82.9% |
| Immigrants | Guatemala | 0.0 /100 | #283 | Tragic 82.9% |
| Immigrants | Dominican Republic | 0.0 /100 | #284 | Tragic 82.9% |
| Fijians | 0.0 /100 | #285 | Tragic 82.9% |
| Immigrants | Bangladesh | 0.0 /100 | #286 | Tragic 82.9% |