Welsh vs Immigrants from Micronesia Median Female Earnings
COMPARE
Welsh
Immigrants from Micronesia
Median Female Earnings
Median Female Earnings Comparison
Welsh
Immigrants from Micronesia
$37,856
MEDIAN FEMALE EARNINGS
2.1/ 100
METRIC RATING
251st/ 347
METRIC RANK
$35,477
MEDIAN FEMALE EARNINGS
0.0/ 100
METRIC RATING
298th/ 347
METRIC RANK
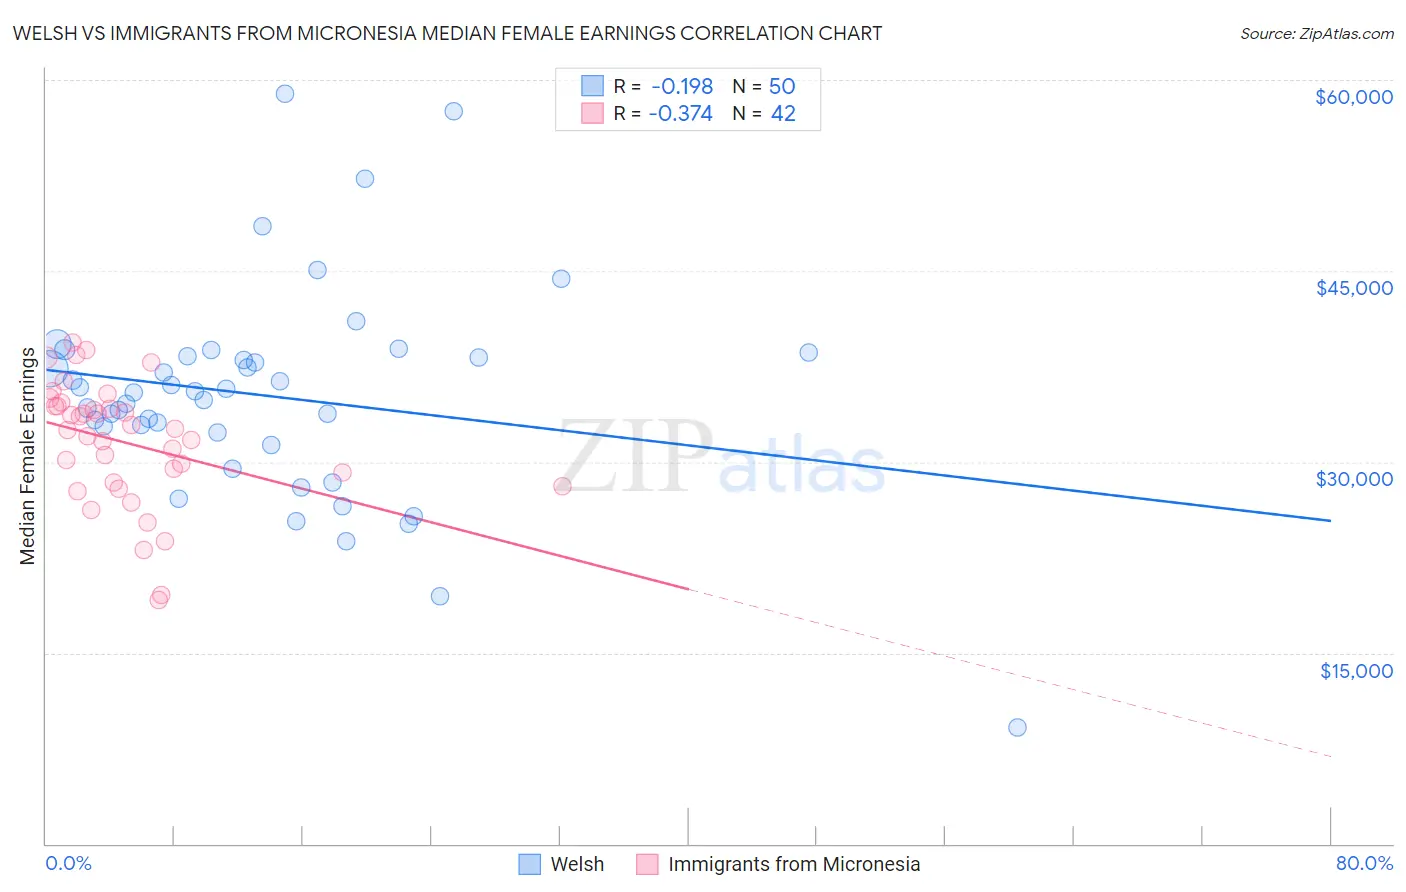
Welsh vs Immigrants from Micronesia Median Female Earnings Correlation Chart
The statistical analysis conducted on geographies consisting of 527,602,521 people shows a poor negative correlation between the proportion of Welsh and median female earnings in the United States with a correlation coefficient (R) of -0.198 and weighted average of $37,856. Similarly, the statistical analysis conducted on geographies consisting of 61,601,305 people shows a mild negative correlation between the proportion of Immigrants from Micronesia and median female earnings in the United States with a correlation coefficient (R) of -0.374 and weighted average of $35,477, a difference of 6.7%.
Median Female Earnings Correlation Summary
| Measurement | Welsh | Immigrants from Micronesia |
| Minimum | $9,167 | $19,167 |
| Maximum | $58,927 | $39,412 |
| Range | $49,760 | $20,245 |
| Mean | $35,195 | $31,538 |
| Median | $35,531 | $32,587 |
| Interquartile 25% (IQ1) | $32,290 | $28,333 |
| Interquartile 75% (IQ3) | $38,296 | $34,418 |
| Interquartile Range (IQR) | $6,005 | $6,085 |
| Standard Deviation (Sample) | $8,494 | $4,851 |
| Standard Deviation (Population) | $8,409 | $4,793 |
Similar Demographics by Median Female Earnings
Demographics Similar to Welsh by Median Female Earnings
In terms of median female earnings, the demographic groups most similar to Welsh are Immigrants from Iraq ($37,864, a difference of 0.020%), Immigrants from Dominica ($37,825, a difference of 0.080%), Alaskan Athabascan ($37,905, a difference of 0.13%), Swiss ($37,904, a difference of 0.13%), and Immigrants from Somalia ($37,914, a difference of 0.15%).
| Demographics | Rating | Rank | Median Female Earnings |
| Immigrants | Liberia | 2.7 /100 | #244 | Tragic $37,970 |
| Immigrants | Middle Africa | 2.7 /100 | #245 | Tragic $37,965 |
| Delaware | 2.6 /100 | #246 | Tragic $37,964 |
| Immigrants | Somalia | 2.4 /100 | #247 | Tragic $37,914 |
| Alaskan Athabascans | 2.3 /100 | #248 | Tragic $37,905 |
| Swiss | 2.3 /100 | #249 | Tragic $37,904 |
| Immigrants | Iraq | 2.2 /100 | #250 | Tragic $37,864 |
| Welsh | 2.1 /100 | #251 | Tragic $37,856 |
| Immigrants | Dominica | 2.0 /100 | #252 | Tragic $37,825 |
| Danes | 1.6 /100 | #253 | Tragic $37,730 |
| Whites/Caucasians | 1.1 /100 | #254 | Tragic $37,531 |
| Colville | 1.1 /100 | #255 | Tragic $37,514 |
| Samoans | 1.0 /100 | #256 | Tragic $37,498 |
| Hawaiians | 1.0 /100 | #257 | Tragic $37,497 |
| Belizeans | 0.9 /100 | #258 | Tragic $37,429 |
Demographics Similar to Immigrants from Micronesia by Median Female Earnings
In terms of median female earnings, the demographic groups most similar to Immigrants from Micronesia are Hmong ($35,498, a difference of 0.060%), Immigrants from Guatemala ($35,444, a difference of 0.090%), Yuman ($35,377, a difference of 0.28%), Mexican American Indian ($35,629, a difference of 0.43%), and Pima ($35,326, a difference of 0.43%).
| Demographics | Rating | Rank | Median Female Earnings |
| Blackfeet | 0.0 /100 | #291 | Tragic $35,864 |
| Americans | 0.0 /100 | #292 | Tragic $35,777 |
| Guatemalans | 0.0 /100 | #293 | Tragic $35,695 |
| Cheyenne | 0.0 /100 | #294 | Tragic $35,673 |
| Comanche | 0.0 /100 | #295 | Tragic $35,661 |
| Mexican American Indians | 0.0 /100 | #296 | Tragic $35,629 |
| Hmong | 0.0 /100 | #297 | Tragic $35,498 |
| Immigrants | Micronesia | 0.0 /100 | #298 | Tragic $35,477 |
| Immigrants | Guatemala | 0.0 /100 | #299 | Tragic $35,444 |
| Yuman | 0.0 /100 | #300 | Tragic $35,377 |
| Pima | 0.0 /100 | #301 | Tragic $35,326 |
| Blacks/African Americans | 0.0 /100 | #302 | Tragic $35,315 |
| Immigrants | Latin America | 0.0 /100 | #303 | Tragic $35,307 |
| Crow | 0.0 /100 | #304 | Tragic $35,266 |
| Bahamians | 0.0 /100 | #305 | Tragic $35,125 |