Immigrants from Haiti vs Immigrants from Micronesia Median Female Earnings
COMPARE
Immigrants from Haiti
Immigrants from Micronesia
Median Female Earnings
Median Female Earnings Comparison
Immigrants from Haiti
Immigrants from Micronesia
$36,203
MEDIAN FEMALE EARNINGS
0.1/ 100
METRIC RATING
283rd/ 347
METRIC RANK
$35,477
MEDIAN FEMALE EARNINGS
0.0/ 100
METRIC RATING
298th/ 347
METRIC RANK
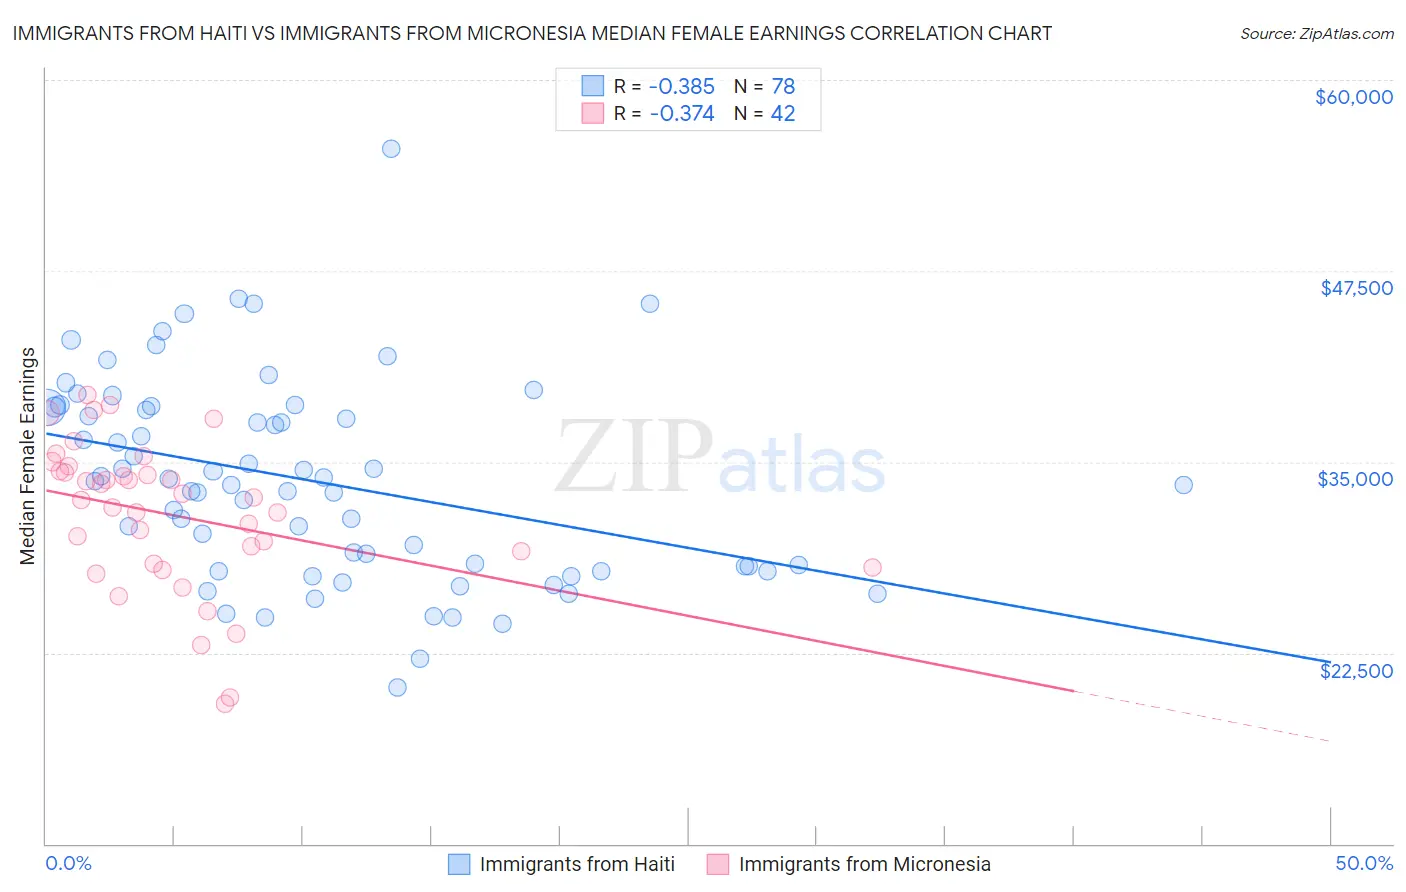
Immigrants from Haiti vs Immigrants from Micronesia Median Female Earnings Correlation Chart
The statistical analysis conducted on geographies consisting of 225,248,114 people shows a mild negative correlation between the proportion of Immigrants from Haiti and median female earnings in the United States with a correlation coefficient (R) of -0.385 and weighted average of $36,203. Similarly, the statistical analysis conducted on geographies consisting of 61,601,305 people shows a mild negative correlation between the proportion of Immigrants from Micronesia and median female earnings in the United States with a correlation coefficient (R) of -0.374 and weighted average of $35,477, a difference of 2.1%.
Median Female Earnings Correlation Summary
| Measurement | Immigrants from Haiti | Immigrants from Micronesia |
| Minimum | $20,229 | $19,167 |
| Maximum | $55,536 | $39,412 |
| Range | $35,307 | $20,245 |
| Mean | $33,736 | $31,538 |
| Median | $33,585 | $32,587 |
| Interquartile 25% (IQ1) | $28,139 | $28,333 |
| Interquartile 75% (IQ3) | $38,581 | $34,418 |
| Interquartile Range (IQR) | $10,442 | $6,085 |
| Standard Deviation (Sample) | $6,572 | $4,851 |
| Standard Deviation (Population) | $6,529 | $4,793 |
Demographics Similar to Immigrants from Haiti and Immigrants from Micronesia by Median Female Earnings
In terms of median female earnings, the demographic groups most similar to Immigrants from Haiti are Indonesian ($36,140, a difference of 0.17%), Paiute ($36,056, a difference of 0.41%), Haitian ($36,374, a difference of 0.47%), Osage ($36,034, a difference of 0.47%), and Immigrants from Nicaragua ($36,023, a difference of 0.50%). Similarly, the demographic groups most similar to Immigrants from Micronesia are Hmong ($35,498, a difference of 0.060%), Immigrants from Guatemala ($35,444, a difference of 0.090%), Yuman ($35,377, a difference of 0.28%), Mexican American Indian ($35,629, a difference of 0.43%), and Comanche ($35,661, a difference of 0.52%).
| Demographics | Rating | Rank | Median Female Earnings |
| Iroquois | 0.1 /100 | #280 | Tragic $36,408 |
| Spanish Americans | 0.1 /100 | #281 | Tragic $36,391 |
| Haitians | 0.1 /100 | #282 | Tragic $36,374 |
| Immigrants | Haiti | 0.1 /100 | #283 | Tragic $36,203 |
| Indonesians | 0.1 /100 | #284 | Tragic $36,140 |
| Paiute | 0.1 /100 | #285 | Tragic $36,056 |
| Osage | 0.0 /100 | #286 | Tragic $36,034 |
| Immigrants | Nicaragua | 0.0 /100 | #287 | Tragic $36,023 |
| Immigrants | Zaire | 0.0 /100 | #288 | Tragic $36,017 |
| Bangladeshis | 0.0 /100 | #289 | Tragic $35,960 |
| Central American Indians | 0.0 /100 | #290 | Tragic $35,930 |
| Blackfeet | 0.0 /100 | #291 | Tragic $35,864 |
| Americans | 0.0 /100 | #292 | Tragic $35,777 |
| Guatemalans | 0.0 /100 | #293 | Tragic $35,695 |
| Cheyenne | 0.0 /100 | #294 | Tragic $35,673 |
| Comanche | 0.0 /100 | #295 | Tragic $35,661 |
| Mexican American Indians | 0.0 /100 | #296 | Tragic $35,629 |
| Hmong | 0.0 /100 | #297 | Tragic $35,498 |
| Immigrants | Micronesia | 0.0 /100 | #298 | Tragic $35,477 |
| Immigrants | Guatemala | 0.0 /100 | #299 | Tragic $35,444 |
| Yuman | 0.0 /100 | #300 | Tragic $35,377 |