Houma vs Immigrants from Northern Europe Median Family Income
COMPARE
Houma
Immigrants from Northern Europe
Median Family Income
Median Family Income Comparison
Houma
Immigrants from Northern Europe
$76,188
MEDIAN FAMILY INCOME
0.0/ 100
METRIC RATING
343rd/ 347
METRIC RANK
$121,840
MEDIAN FAMILY INCOME
100.0/ 100
METRIC RATING
24th/ 347
METRIC RANK
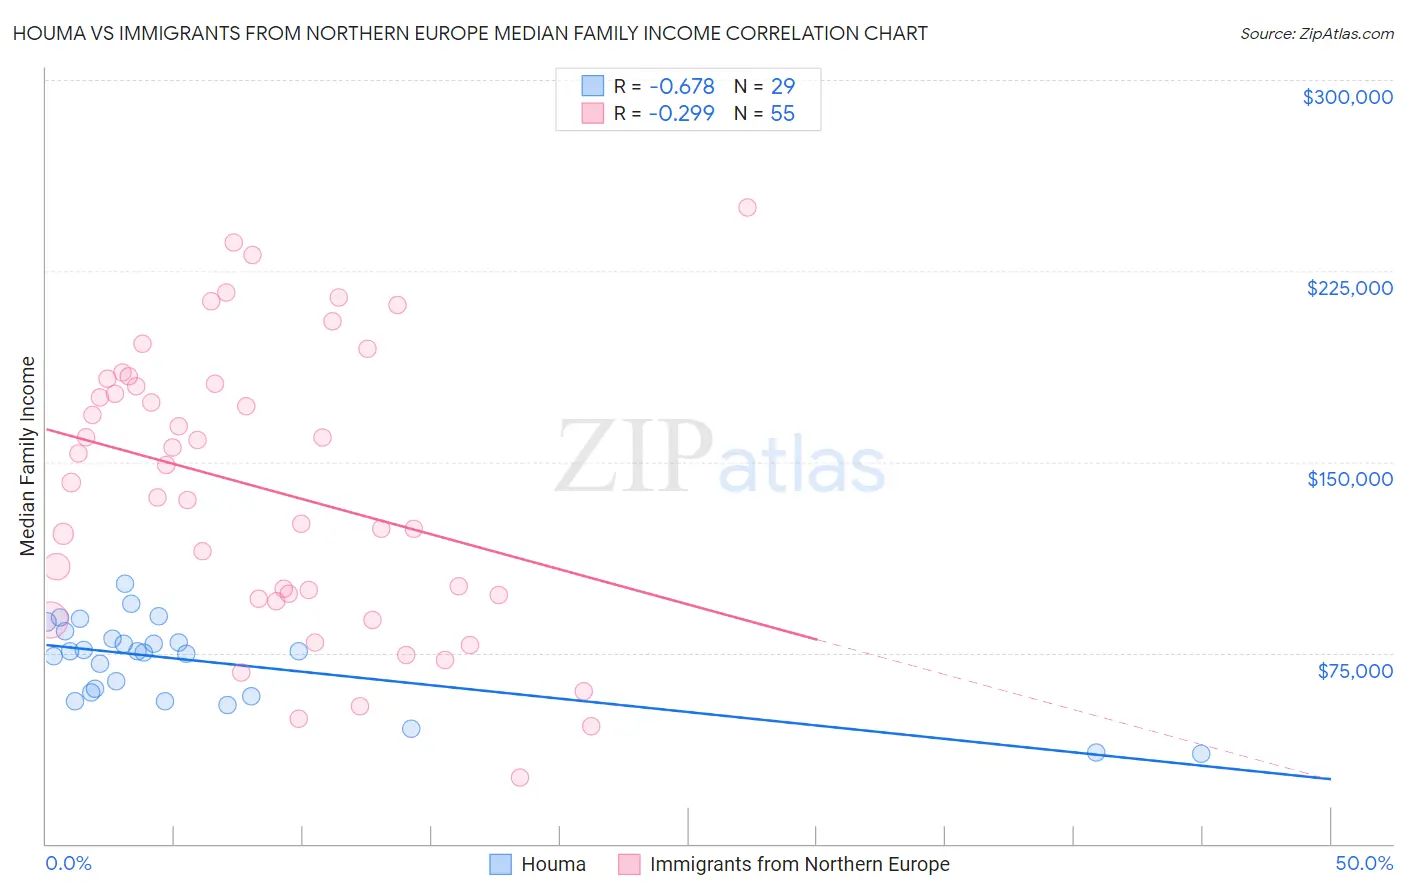
Houma vs Immigrants from Northern Europe Median Family Income Correlation Chart
The statistical analysis conducted on geographies consisting of 36,790,797 people shows a significant negative correlation between the proportion of Houma and median family income in the United States with a correlation coefficient (R) of -0.678 and weighted average of $76,188. Similarly, the statistical analysis conducted on geographies consisting of 476,742,479 people shows a weak negative correlation between the proportion of Immigrants from Northern Europe and median family income in the United States with a correlation coefficient (R) of -0.299 and weighted average of $121,840, a difference of 59.9%.
Median Family Income Correlation Summary
| Measurement | Houma | Immigrants from Northern Europe |
| Minimum | $35,539 | $26,250 |
| Maximum | $102,344 | $250,001 |
| Range | $66,805 | $223,751 |
| Mean | $71,438 | $139,082 |
| Median | $75,379 | $142,088 |
| Interquartile 25% (IQ1) | $58,820 | $96,250 |
| Interquartile 75% (IQ3) | $82,023 | $180,658 |
| Interquartile Range (IQR) | $23,203 | $84,408 |
| Standard Deviation (Sample) | $16,513 | $55,193 |
| Standard Deviation (Population) | $16,226 | $54,689 |
Similar Demographics by Median Family Income
Demographics Similar to Houma by Median Family Income
In terms of median family income, the demographic groups most similar to Houma are Crow ($76,605, a difference of 0.55%), Pueblo ($76,880, a difference of 0.91%), Hopi ($77,188, a difference of 1.3%), Pima ($77,431, a difference of 1.6%), and Immigrants from Yemen ($77,457, a difference of 1.7%).
| Demographics | Rating | Rank | Median Family Income |
| Kiowa | 0.0 /100 | #333 | Tragic $80,885 |
| Menominee | 0.0 /100 | #334 | Tragic $79,563 |
| Yup'ik | 0.0 /100 | #335 | Tragic $79,290 |
| Immigrants | Cuba | 0.0 /100 | #336 | Tragic $78,249 |
| Yuman | 0.0 /100 | #337 | Tragic $78,055 |
| Immigrants | Yemen | 0.0 /100 | #338 | Tragic $77,457 |
| Pima | 0.0 /100 | #339 | Tragic $77,431 |
| Hopi | 0.0 /100 | #340 | Tragic $77,188 |
| Pueblo | 0.0 /100 | #341 | Tragic $76,880 |
| Crow | 0.0 /100 | #342 | Tragic $76,605 |
| Houma | 0.0 /100 | #343 | Tragic $76,188 |
| Tohono O'odham | 0.0 /100 | #344 | Tragic $72,193 |
| Navajo | 0.0 /100 | #345 | Tragic $70,989 |
| Puerto Ricans | 0.0 /100 | #346 | Tragic $70,423 |
| Lumbee | 0.0 /100 | #347 | Tragic $68,679 |
Demographics Similar to Immigrants from Northern Europe by Median Family Income
In terms of median family income, the demographic groups most similar to Immigrants from Northern Europe are Turkish ($121,202, a difference of 0.53%), Immigrants from Sweden ($122,765, a difference of 0.76%), Immigrants from Japan ($122,764, a difference of 0.76%), Immigrants from Korea ($122,800, a difference of 0.79%), and Immigrants from Switzerland ($120,726, a difference of 0.92%).
| Demographics | Rating | Rank | Median Family Income |
| Indians (Asian) | 100.0 /100 | #17 | Exceptional $125,312 |
| Immigrants | Eastern Asia | 100.0 /100 | #18 | Exceptional $125,150 |
| Immigrants | Belgium | 100.0 /100 | #19 | Exceptional $123,831 |
| Burmese | 100.0 /100 | #20 | Exceptional $123,369 |
| Immigrants | Korea | 100.0 /100 | #21 | Exceptional $122,800 |
| Immigrants | Sweden | 100.0 /100 | #22 | Exceptional $122,765 |
| Immigrants | Japan | 100.0 /100 | #23 | Exceptional $122,764 |
| Immigrants | Northern Europe | 100.0 /100 | #24 | Exceptional $121,840 |
| Turks | 100.0 /100 | #25 | Exceptional $121,202 |
| Immigrants | Switzerland | 100.0 /100 | #26 | Exceptional $120,726 |
| Russians | 100.0 /100 | #27 | Exceptional $120,487 |
| Immigrants | Denmark | 100.0 /100 | #28 | Exceptional $120,445 |
| Latvians | 100.0 /100 | #29 | Exceptional $120,301 |
| Immigrants | Sri Lanka | 100.0 /100 | #30 | Exceptional $120,263 |
| Immigrants | France | 100.0 /100 | #31 | Exceptional $120,076 |