Houma vs Immigrants from Zimbabwe Median Family Income
COMPARE
Houma
Immigrants from Zimbabwe
Median Family Income
Median Family Income Comparison
Houma
Immigrants from Zimbabwe
$76,188
MEDIAN FAMILY INCOME
0.0/ 100
METRIC RATING
343rd/ 347
METRIC RANK
$108,830
MEDIAN FAMILY INCOME
95.9/ 100
METRIC RATING
108th/ 347
METRIC RANK
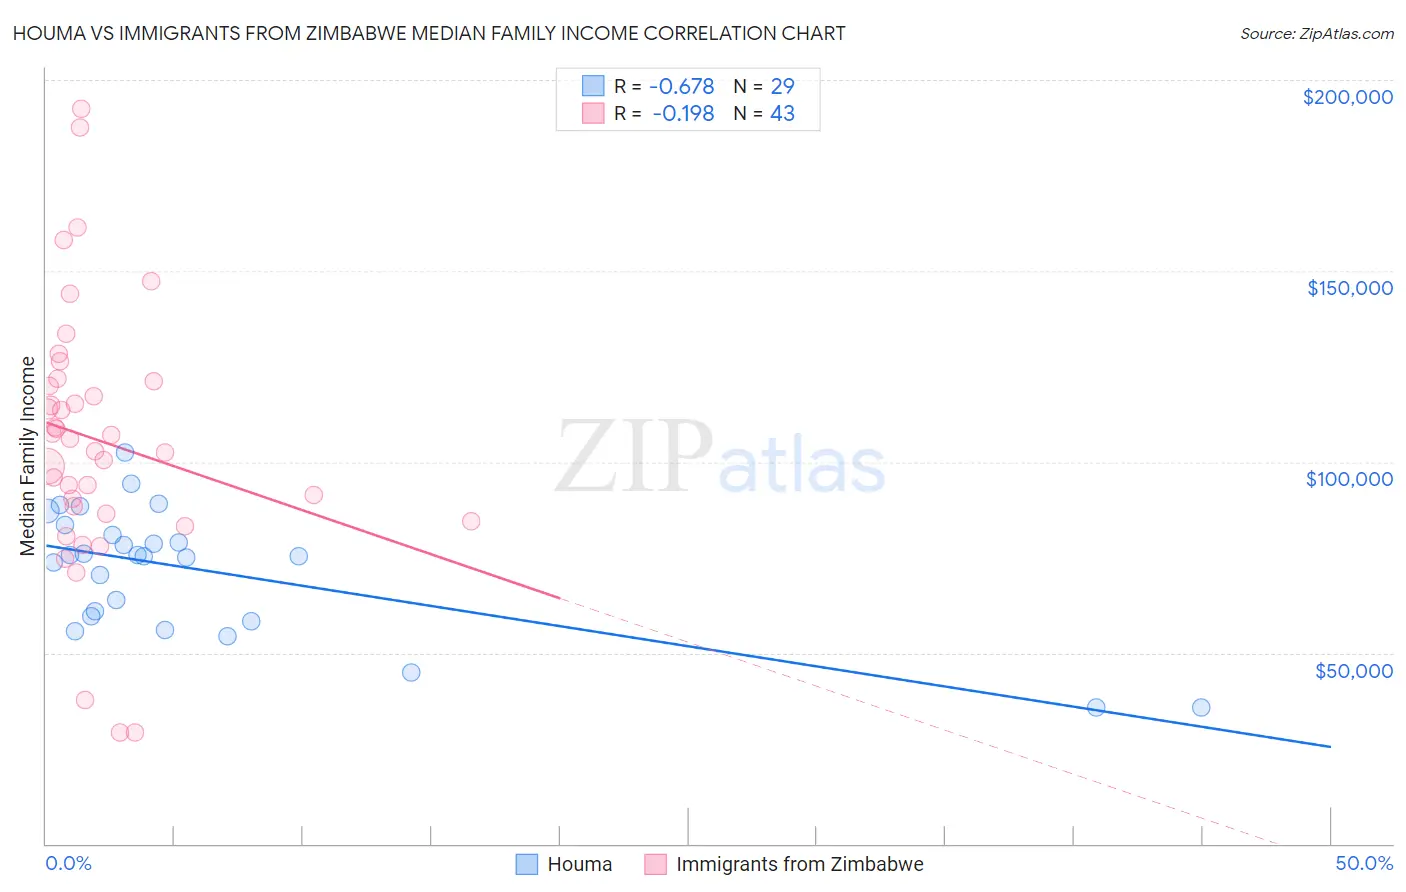
Houma vs Immigrants from Zimbabwe Median Family Income Correlation Chart
The statistical analysis conducted on geographies consisting of 36,790,797 people shows a significant negative correlation between the proportion of Houma and median family income in the United States with a correlation coefficient (R) of -0.678 and weighted average of $76,188. Similarly, the statistical analysis conducted on geographies consisting of 117,781,123 people shows a poor negative correlation between the proportion of Immigrants from Zimbabwe and median family income in the United States with a correlation coefficient (R) of -0.198 and weighted average of $108,830, a difference of 42.8%.
Median Family Income Correlation Summary
| Measurement | Houma | Immigrants from Zimbabwe |
| Minimum | $35,539 | $29,063 |
| Maximum | $102,344 | $192,404 |
| Range | $66,805 | $163,341 |
| Mean | $71,438 | $105,675 |
| Median | $75,379 | $105,969 |
| Interquartile 25% (IQ1) | $58,820 | $86,427 |
| Interquartile 75% (IQ3) | $82,023 | $121,096 |
| Interquartile Range (IQR) | $23,203 | $34,669 |
| Standard Deviation (Sample) | $16,513 | $34,287 |
| Standard Deviation (Population) | $16,226 | $33,886 |
Similar Demographics by Median Family Income
Demographics Similar to Houma by Median Family Income
In terms of median family income, the demographic groups most similar to Houma are Crow ($76,605, a difference of 0.55%), Pueblo ($76,880, a difference of 0.91%), Hopi ($77,188, a difference of 1.3%), Pima ($77,431, a difference of 1.6%), and Immigrants from Yemen ($77,457, a difference of 1.7%).
| Demographics | Rating | Rank | Median Family Income |
| Kiowa | 0.0 /100 | #333 | Tragic $80,885 |
| Menominee | 0.0 /100 | #334 | Tragic $79,563 |
| Yup'ik | 0.0 /100 | #335 | Tragic $79,290 |
| Immigrants | Cuba | 0.0 /100 | #336 | Tragic $78,249 |
| Yuman | 0.0 /100 | #337 | Tragic $78,055 |
| Immigrants | Yemen | 0.0 /100 | #338 | Tragic $77,457 |
| Pima | 0.0 /100 | #339 | Tragic $77,431 |
| Hopi | 0.0 /100 | #340 | Tragic $77,188 |
| Pueblo | 0.0 /100 | #341 | Tragic $76,880 |
| Crow | 0.0 /100 | #342 | Tragic $76,605 |
| Houma | 0.0 /100 | #343 | Tragic $76,188 |
| Tohono O'odham | 0.0 /100 | #344 | Tragic $72,193 |
| Navajo | 0.0 /100 | #345 | Tragic $70,989 |
| Puerto Ricans | 0.0 /100 | #346 | Tragic $70,423 |
| Lumbee | 0.0 /100 | #347 | Tragic $68,679 |
Demographics Similar to Immigrants from Zimbabwe by Median Family Income
In terms of median family income, the demographic groups most similar to Immigrants from Zimbabwe are Immigrants from Afghanistan ($108,709, a difference of 0.11%), British ($108,705, a difference of 0.12%), Immigrants from Western Asia ($108,691, a difference of 0.13%), Immigrants from Poland ($108,570, a difference of 0.24%), and Immigrants from Saudi Arabia ($108,544, a difference of 0.26%).
| Demographics | Rating | Rank | Median Family Income |
| Immigrants | Ukraine | 97.2 /100 | #101 | Exceptional $109,645 |
| Assyrians/Chaldeans/Syriacs | 97.2 /100 | #102 | Exceptional $109,622 |
| Immigrants | Brazil | 96.9 /100 | #103 | Exceptional $109,418 |
| Palestinians | 96.9 /100 | #104 | Exceptional $109,413 |
| Syrians | 96.7 /100 | #105 | Exceptional $109,299 |
| Albanians | 96.4 /100 | #106 | Exceptional $109,136 |
| Immigrants | North Macedonia | 96.4 /100 | #107 | Exceptional $109,136 |
| Immigrants | Zimbabwe | 95.9 /100 | #108 | Exceptional $108,830 |
| Immigrants | Afghanistan | 95.6 /100 | #109 | Exceptional $108,709 |
| British | 95.6 /100 | #110 | Exceptional $108,705 |
| Immigrants | Western Asia | 95.6 /100 | #111 | Exceptional $108,691 |
| Immigrants | Poland | 95.3 /100 | #112 | Exceptional $108,570 |
| Immigrants | Saudi Arabia | 95.2 /100 | #113 | Exceptional $108,544 |
| Poles | 95.2 /100 | #114 | Exceptional $108,507 |
| Swedes | 95.1 /100 | #115 | Exceptional $108,499 |