Houma vs European Median Family Income
COMPARE
Houma
European
Median Family Income
Median Family Income Comparison
Houma
Europeans
$76,188
MEDIAN FAMILY INCOME
0.0/ 100
METRIC RATING
343rd/ 347
METRIC RANK
$108,099
MEDIAN FAMILY INCOME
94.1/ 100
METRIC RATING
121st/ 347
METRIC RANK
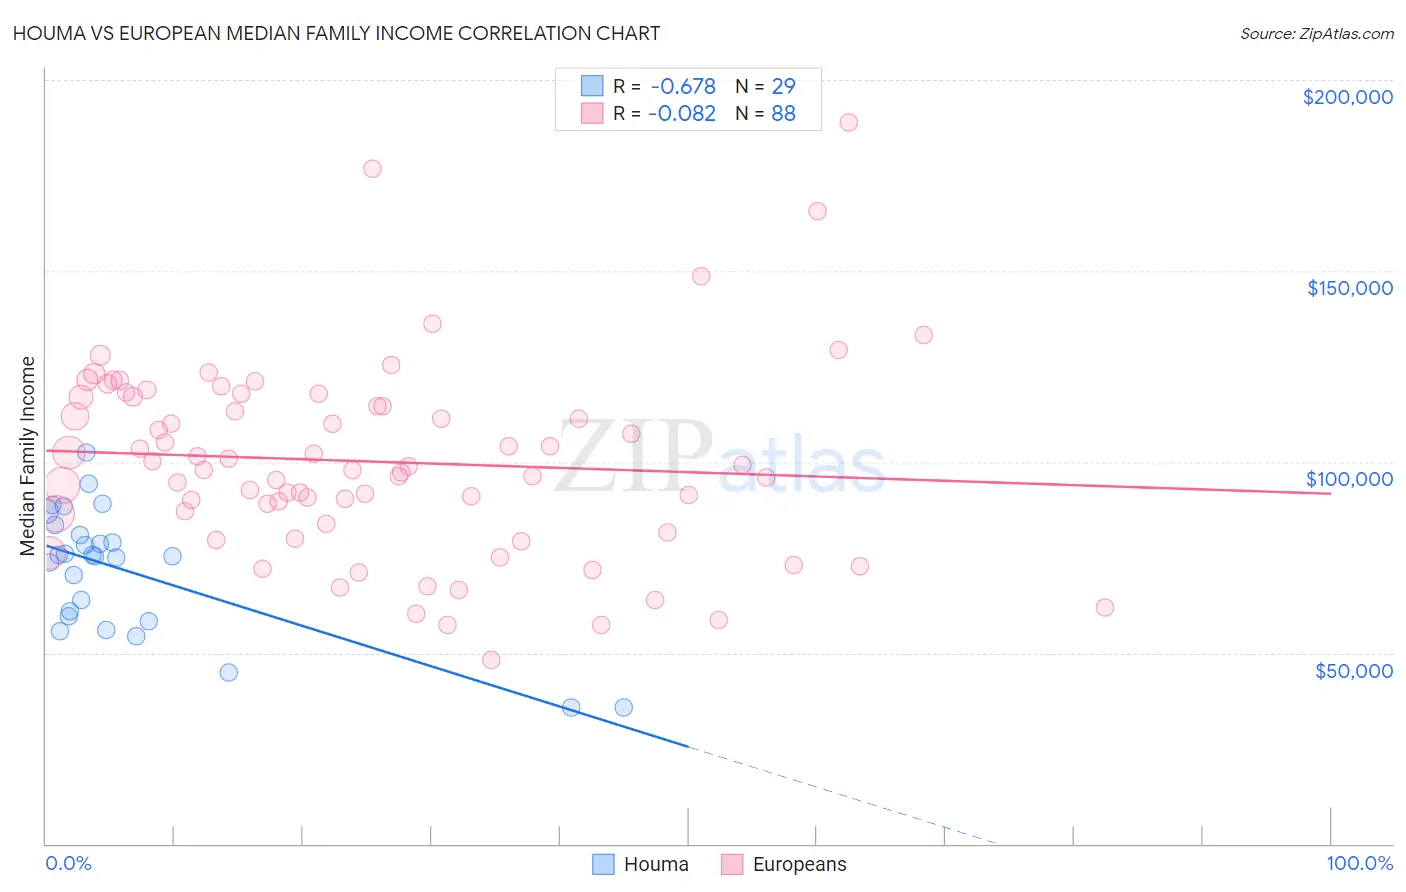
Houma vs European Median Family Income Correlation Chart
The statistical analysis conducted on geographies consisting of 36,790,797 people shows a significant negative correlation between the proportion of Houma and median family income in the United States with a correlation coefficient (R) of -0.678 and weighted average of $76,188. Similarly, the statistical analysis conducted on geographies consisting of 560,683,121 people shows a slight negative correlation between the proportion of Europeans and median family income in the United States with a correlation coefficient (R) of -0.082 and weighted average of $108,099, a difference of 41.9%.
Median Family Income Correlation Summary
| Measurement | Houma | European |
| Minimum | $35,539 | $48,174 |
| Maximum | $102,344 | $188,913 |
| Range | $66,805 | $140,739 |
| Mean | $71,438 | $100,086 |
| Median | $75,379 | $98,374 |
| Interquartile 25% (IQ1) | $58,820 | $85,153 |
| Interquartile 75% (IQ3) | $82,023 | $116,940 |
| Interquartile Range (IQR) | $23,203 | $31,788 |
| Standard Deviation (Sample) | $16,513 | $25,416 |
| Standard Deviation (Population) | $16,226 | $25,271 |
Similar Demographics by Median Family Income
Demographics Similar to Houma by Median Family Income
In terms of median family income, the demographic groups most similar to Houma are Crow ($76,605, a difference of 0.55%), Pueblo ($76,880, a difference of 0.91%), Hopi ($77,188, a difference of 1.3%), Pima ($77,431, a difference of 1.6%), and Immigrants from Yemen ($77,457, a difference of 1.7%).
| Demographics | Rating | Rank | Median Family Income |
| Kiowa | 0.0 /100 | #333 | Tragic $80,885 |
| Menominee | 0.0 /100 | #334 | Tragic $79,563 |
| Yup'ik | 0.0 /100 | #335 | Tragic $79,290 |
| Immigrants | Cuba | 0.0 /100 | #336 | Tragic $78,249 |
| Yuman | 0.0 /100 | #337 | Tragic $78,055 |
| Immigrants | Yemen | 0.0 /100 | #338 | Tragic $77,457 |
| Pima | 0.0 /100 | #339 | Tragic $77,431 |
| Hopi | 0.0 /100 | #340 | Tragic $77,188 |
| Pueblo | 0.0 /100 | #341 | Tragic $76,880 |
| Crow | 0.0 /100 | #342 | Tragic $76,605 |
| Houma | 0.0 /100 | #343 | Tragic $76,188 |
| Tohono O'odham | 0.0 /100 | #344 | Tragic $72,193 |
| Navajo | 0.0 /100 | #345 | Tragic $70,989 |
| Puerto Ricans | 0.0 /100 | #346 | Tragic $70,423 |
| Lumbee | 0.0 /100 | #347 | Tragic $68,679 |
Demographics Similar to Europeans by Median Family Income
In terms of median family income, the demographic groups most similar to Europeans are Immigrants from Northern Africa ($108,161, a difference of 0.060%), Sri Lankan ($108,234, a difference of 0.12%), Ethiopian ($108,251, a difference of 0.14%), Immigrants from Philippines ($108,288, a difference of 0.18%), and Chilean ($108,429, a difference of 0.31%).
| Demographics | Rating | Rank | Median Family Income |
| Poles | 95.2 /100 | #114 | Exceptional $108,507 |
| Swedes | 95.1 /100 | #115 | Exceptional $108,499 |
| Chileans | 95.0 /100 | #116 | Exceptional $108,429 |
| Immigrants | Philippines | 94.6 /100 | #117 | Exceptional $108,288 |
| Ethiopians | 94.5 /100 | #118 | Exceptional $108,251 |
| Sri Lankans | 94.5 /100 | #119 | Exceptional $108,234 |
| Immigrants | Northern Africa | 94.3 /100 | #120 | Exceptional $108,161 |
| Europeans | 94.1 /100 | #121 | Exceptional $108,099 |
| Immigrants | Jordan | 92.9 /100 | #122 | Exceptional $107,715 |
| Carpatho Rusyns | 92.2 /100 | #123 | Exceptional $107,502 |
| Pakistanis | 91.7 /100 | #124 | Exceptional $107,390 |
| Taiwanese | 91.4 /100 | #125 | Exceptional $107,295 |
| Serbians | 90.8 /100 | #126 | Exceptional $107,157 |
| Lebanese | 90.5 /100 | #127 | Exceptional $107,086 |
| Immigrants | Ethiopia | 90.0 /100 | #128 | Excellent $106,969 |